
Please help me to check my IELTS writing task 1. Thank you!!
The following chart shows the results of a British survey taken in 2009 related to Housing preferences of UK people.
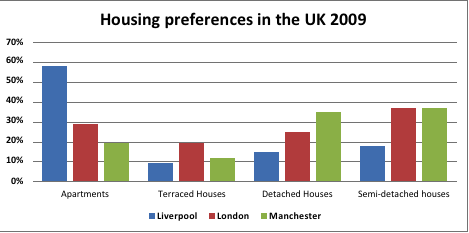
The bar chart provides information about the proportion of accommodations that people wanted in three different cities (Liverpool, London, Manchester respectively) in the UK 2009.
Overall, Liverpool preferred to live in apartments than the others while the semi-detached houses were the most favorite for London and Manchester. In contrast, the percentage of the British's requirement fr the terraced house was minimal.
As can be seen, the apartment's preference rate hit the highest point in Liverpool at about 60%, being surpassing London and Manchester's rate by approximately 30%, and 20% respectively. However, the figure for the other accommodations that the Liverpool desired hit the low-point, reaching around 10% to 20%.
According to London's as wee as Manchester's statistics, both were totally the same level, almost 40%. Samely as the apartments, the inhabitants loved the terraced houses in Longdon was higher than in Manchester, as opposed to almost a third. On the other hand, it was the Manchester that want to live in the detached houses most, around 35%.
Top answer
Please read my advice for Task 1 essays: IELTS TASK 1: Hints, Tips And Advice Vocabulary Words For Task 1: Reference Post
- Please read my advice for Task 1 essays: IELTS TASK 1: Hints, Tips And Advice Vocabulary Words For Task 1: Reference Post
Get the Weekly English Kit 📬
New words, one handy idiom, and a 2-minute quiz — delivered to your inbox to keep your streak alive.
Most of your writing was very poor English. You must write in clear, simple sentences. Your skills are not good for complicated sentences, so you will get a higher score by writing very simple and factual sentences.
The bar chart provides information about (That is very vague. Exactly what is on this chart?)
 Related Questions