
Please help me to check IELTS Writing Task 1: Line Graph
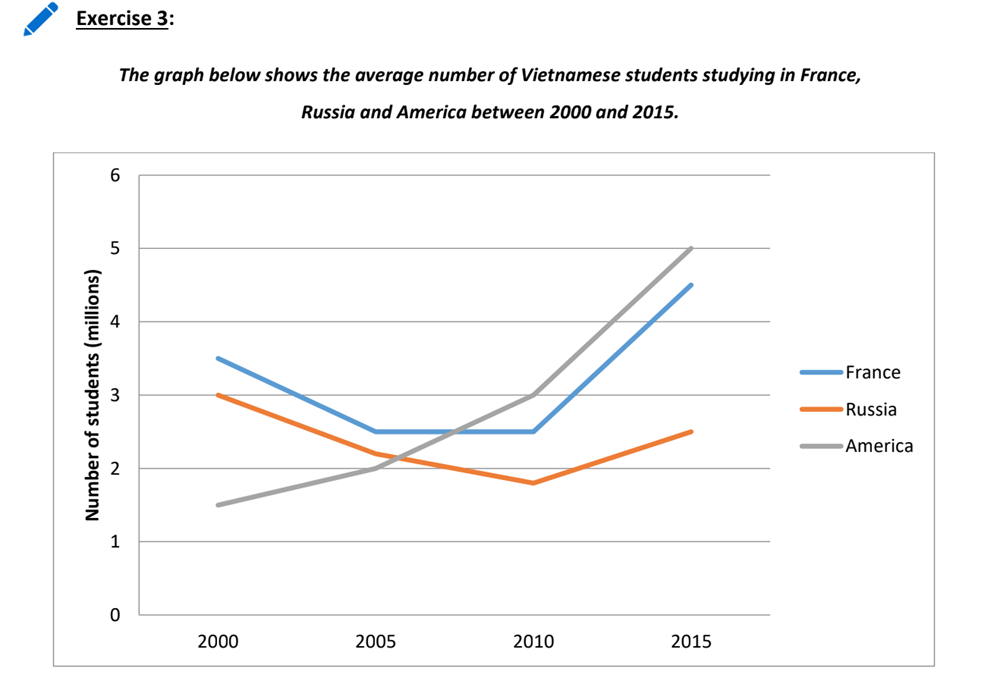
The line graph illustrates how many students of Vietnam were educated in three different countries over a period of 15 years.
It is clear that while the average number of Vietnamese students in America and France increased significantly. The opposite was true for Russia. In addition, the figure for America experienced the highest rise.
In the year 2000, there was an average of nearly 3,5 and 3 million Vi?tnamese students in France and Russia respectively compared to only 1.5 million students choosing America education. Over the next five years, the number of students in both France and Russia witnessed a steady fall, there were 2.5 million in France and 2.2 million in Russia. By contrast, the average number of Vietnamese students in America rose gradually, equal to Russia.
In 2010, the number of students studying in America surpassed that in France and Russia, stood at 3 million students while Russia continued falling in the number of students, 1.8 million. There was a stability in the figure for France during the same period. From the year 2010 onward, all the countries saw a rise. To be specific, the average number of students in America and France increase considerably, 6 and 5.5 million Vietnamese students respectively. The figure for Russia was 2.5 million students.
Top answer
m 1929 The line graph ( 1) illustrates how many students of ( 2) Vietnam were educated ( 3) in three different countries ( 4) over a period of 15 years . ( 5) 1. Poor choice of verbs.
- m 1929 The line graph ( 1) illustrates how many students of ( 2) Vietnam were educated ( 3) in three different countries ( 4) over a period of 15 years .
- ( 5) 1.
- Poor choice of verbs.
- " Use this verb for maps, diagrams, process flows and other pictorial graphics.
- Do NOT use this verb for graphs, pie charts and bar charts.
Get the Weekly English Kit 📬
New words, one handy idiom, and a 2-minute quiz — delivered to your inbox to keep your streak alive.
Th?o Ph?m 1929The line graph ( 1) illustrates how many students of ( 2) Vietnam were educated ( 3) in three different countries ( 4) over a perio
Hello Mr Simon I am glad to see your line graph and also the answers are atractive ,Mr Simon thanks for your help ,I learned a lot from you
Hello everyone I am so happy to joint this group so that Could you help me to increase my writing
 Related Questions