
Please help me to assess my Ielts task 1. Thanks in advance
The graph below shows informati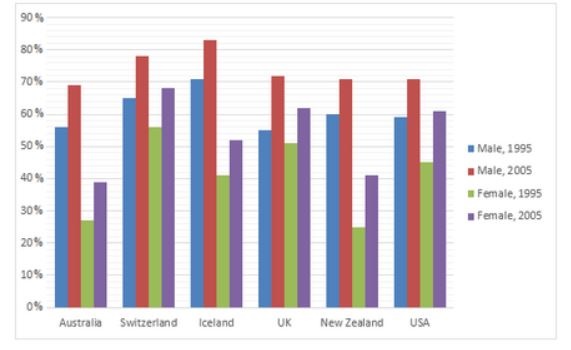
on on employment rates across 6 countries in 1995 and 2005.
Summarise the information by choosing and describe the main idea, and make comparisons where appropriate.
The bar chart compares the data about the employed man and woman levels in 6 nations: Australia, Switzerland, Iceland, the UK, New Zealand, and the USA in 1995 and 2005.
Overall, the percentages of employed men were relatively higher than those of women and the employment rates in both genders increased from 1995 to 2005.
In 1995, around 27% of females in Australia and New Zealand had jobs, compared with approximately 55% of males in both two countries. The proportions of these countries rose to roundly 40% for women and 70% for men by 2005. In Iceland, the figures for females who were employed was 40% and over 50% in 1995 and 2005, respectively. However, the employed rate of males in Iceland was the highest among these 6 countries, with over 70% in 1995 and around 82% in 2005.
The employment rates in Switzerland and the UK remained over 50% for both genders. The highest employed rate in women was Switzerland in both 1995 (55%) and 2005 (68%). For the USA, the employment rates were still high.
Top answer
Summarise the information by choosing and describe the main idea , and make comparisons where appropriate. Where did you find this task? The instructions have errors.
- Summarise the information by choosing and describe the main idea , and make comparisons where appropriate.
- Where did you find this task?
- The instructions have errors.
- Avoid writing practice tests where the person who wrote the test cannot write good English.
- Please read my advice for Task 1 essays: IELTS TASK 1: Hints, Tips And Advice Vocabulary Words For Task 1: Reference Post
Get the Weekly English Kit 📬
New words, one handy idiom, and a 2-minute quiz — delivered to your inbox to keep your streak alive.
Anh Dung HoàngThe graph below shows information on employment rates across 6 countries in 1995 and 2005.Summarise the information by choosing and describe the main idea, and make comparisons where appropriate.
Where did you find this task? The instructions have err
The bar chart compares the data (What is on this chart? What is the scale on the Y-axis?) about the employed man and woman levels (very unnatural.) in 6 (write words for small numbers that are not data values)
Sample essay:
The bar graph compares the employment rates for men and women for two years, 1995 and 2005, in six countries: Australia, New Zealand, Iceland, Switzerland, the UK and the USA.
Overall, the rates for men were higher than women in every combination of country and year. In addition, rates increased, without exception, from 1995 to 2005. Only two countries, Switzerland an
 Related Questions