
Please help me review this task 1 IELTS writing
Topic:
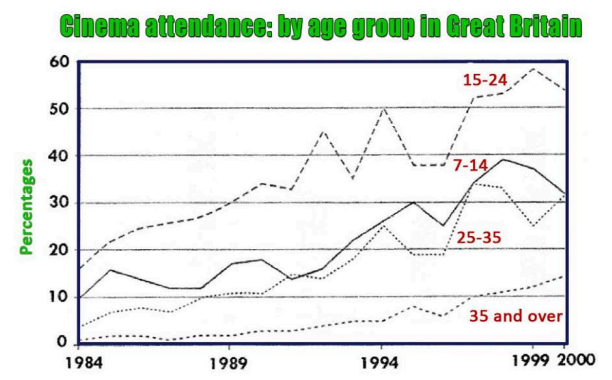
The chart below shows the percentage of cinema attendance by age group in Great Britain from 1984 to 2000.
Summarise the information by selecting and reporting the main features, and make comparisons where relevant
My essay:
The line graph illustrates the proportion of people who went to the cinema in Great Britain in four age groups from 1984 to 2000.
Overall, during 16 years, the percentage of cinema attendance increased significantly. Moreover, the youngster is mostly attracted by this activity.
Start with 17% in 1984, the percentage of cinema attendance in the age from 15 to 24 increased rapidly until 1990. Then the nation witnessed a considerable fluctuation and keep stable form 1995 to 1996. It reached the top at 58% then dropped in 2000. Unlike the youngster, the older age from 35 and over went up slightly and reached 14% in 2000 except for a minor fluctuation from 1994 to 1997.
To the age from 25 to 35, the proportion of cinema attendance climbed up considerably until 1994. While the percentage of the youngest age group expecienced many climbs and falls. It went up to 30% in 1995, then dropped and finally climbed up and reached the top in 1997. The percentage of the older age group increased slightly and had two years of stability. In 1996, it climbed to the top of 33% then fell down in 1997 and went up to 31% in 2000.
*****************************************************
Can you give me the the grade in IELTS band and tell me which part I need to correct improve? I will really appeciate that.
Thank you so much for spending time reading my writing!
Top answer
The line graph illustrates plots the proportion of people in each of four different age groups who went to the cinema in Great Britain in four age groups from 1984 to 2000. (The description is not complete. Specify the age groups that are on the graph.
- The line graph illustrates plots the proportion of people in each of four different age groups who went to the cinema in Great Britain in four age groups from 1984 to 2000.
- (The description is not complete.
- Specify the age groups that are on the graph.
- ) Your writing is not very natural English.
- Also, you use qualitative words (slight, significant, considerable) rather than quantitative words (values and numbers.
Get the Weekly English Kit 📬
New words, one handy idiom, and a 2-minute quiz — delivered to your inbox to keep your streak alive.
The line graph illustrates plots the proportion of people in each of four different age groups who went to the cinema in Great Britain in four age groups from 1984 to 2000. (The description is not complete. Specify the age groups that are on the graph. Then you can refer to them in the body paragraphs.)
Your writing is not very natural Englis
 Related Questions