
Please help me review this IELTS writing task 1
Topic:
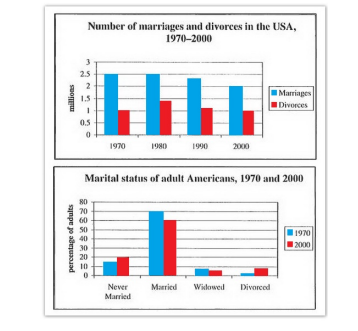
The chart below shows the number of marriages and divorces in the USA from 1970 to 2000 and marital status of adult Americans in 1970 and 2000
Summarise the information by selecting and reporting the main features, and make comparisons where relevant
My essay:
The first chart describe the quantity of marriage and divorces in the USA from 1970 to 2000 while the other plots the marital status of American adults in 1970 and 2000.
Overall, in general, the rate of divorces was lower than that of marriages. In 1970 and 2000, married still took the highest proportion among four statuses.
According to the first chart, in the first decade of the period, the number of marriages remained unchange at 2.5 million while the figure of divorces climbed from 1 million to 1.4 million. In the second halp of the period, marriages and divorces had the same trend of decreasing. In 2000, the number of marriages was 2 million and that of divorces was 1 million lower.
In terms of marital status among adults Americans, married was still the highest one with 70% in 1970 and 10% lower in 2000. The proportion of never married people increased from 15% in 1970 to 20% in 2000. Similarly, the divorced went up by 6% in 30 years. Meanwhile, the nation witnessec a slight drop of the percentage of widowed from 8% to 2% in 2000
Top answer
Please help me review this IELTS writing task 1. (This means that you will review the essay. ) Please help me by reviewing this IELTS writing task 1.
- Please help me review this IELTS writing task 1.
- (This means that you will review the essay.
- ) Please help me by reviewing this IELTS writing task 1.
- (The means that you ask me to review the essay.
- ) chart describe (wrong form) the quantity (wrong word.
Get the Weekly English Kit 📬
New words, one handy idiom, and a 2-minute quiz — delivered to your inbox to keep your streak alive.
Please help me review this IELTS writing task 1. (This means that you will review the essay. You ask me to help.)
Please help me by reviewing this IELTS writing task 1. (The means that you ask me to review the essay. That will help you.)
The first (what kind of chart?) chart describe (wrong form)
 Related Questions