
Please help me review this IELTS task 1
---------------------------------------
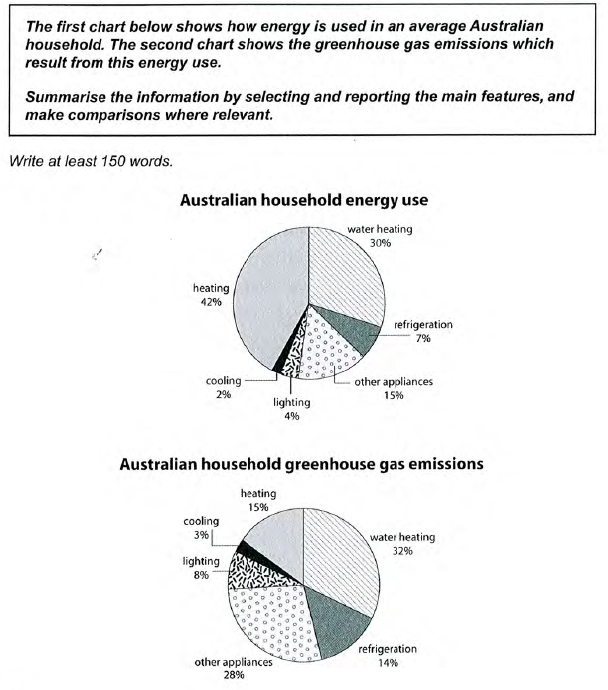
The two pie charts plot the proportion of energy use by purposes and their contribution shares to the greenhouse effect in an Australian household. They include six categories of heating, water heating, refrigeration, lightning, cooling, and other appliances.
Overall, the energy consumed for room and water heating made up the largest energy demand while water heating and household appliances were the biggest source of greenhouse-induced gases released by a house.
Regarding more details, an Australian family utilized 42% of energy for heating up their home and 30% for hot water. The remaining 28% was attributed to other devices such as refrigerator (7%), other appliances (15%), lightning (4%) and cooling (2%). In terms of greenhouse gas emission, boiling water released highest volume of gas (32%) following by using other appliances (28%) as well as refrigeration (14%). Room heating was the third contributor responsible for 15% to the total gas emissions despite consuming the largest amount of energy.
The rest of energy consumption was spent for lightning and cooling systems with 4% and 2%, respectively. They occupied only 8 and 3% of emitted gases which cause greenhouse phenomenon.
Top answer
The two pie charts plot the proportion of energy use by purposes and their contribution shares to the greenhouse effect (wrong usage. The greenhouse effect is a natural process occurring in the earth's atmosphere. gov/greenhouse-effect/ ) in a n typical / average Australian household.
- The two pie charts plot the proportion of energy use by purposes and their contribution shares to the greenhouse effect (wrong usage.
- The greenhouse effect is a natural process occurring in the earth's atmosphere.
- gov/greenhouse-effect/ ) in a n typical / average Australian household.
- ) They (You do not have any good antecedent of "they") include six categories of heating, water heating, refrigeration, lightning, cooling, and other appliances.
- The two pie charts compare the relative energy consumption and greenhouse gas emissions by six different types of appliances in a typical Australian household.
Get the Weekly English Kit 📬
New words, one handy idiom, and a 2-minute quiz — delivered to your inbox to keep your streak alive.
The two pie charts plot the proportion of energy use by purposes and their contribution shares to the greenhouse effect (wrong usage. The greenhouse effect is a natural process occurring in the earth's atmosphere. https://climatekids.nas
 Related Questions