
Please help me review this IELTS task 1
----------------------------------------------
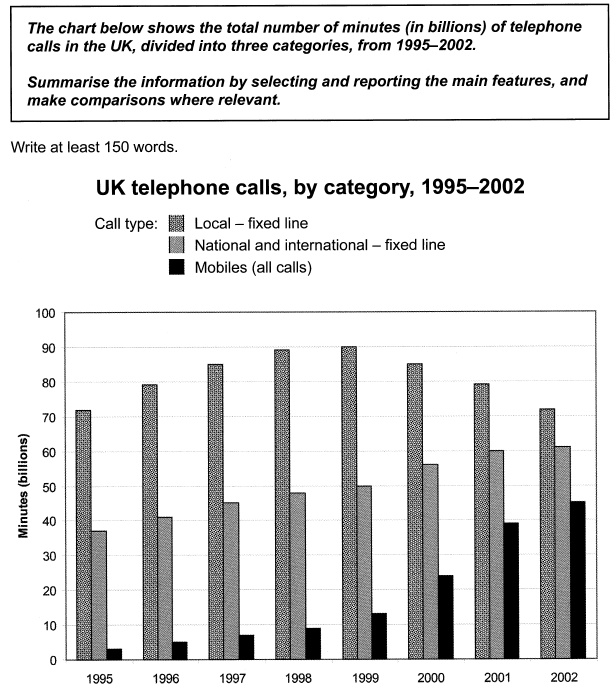
The graph compares the call volume in UK by three types of telephone: local - fixed line, national and international - fixed line, and mobile phone during 8 consecutive years from 1995 to 2002.
Overall, all three categories underwent a developping period when the total number of minutes increased steadily from 1995-1999. However, the quantity of local call by fixed line service gradually dropped while the two other services continued to rise in the latter years.
In the 1995-1999 period, the number of minutes calling by local fixed line increased from 72 to 90 billion minutes which took more than two folds of the combined value of national/international fixed line and mobile phone. After achieving the peak, the call time by local fixed line declined until 2002. By contrast, the call volume of national/international fixed line rose from 36 billions in 1995 to 62 billions (minutes) in 2002. Time spent for mobile call in both domestic and international services increase slightly in the first 5 years, but it has doubled every year from 1999 to achieve 45 billion minutes in 2002.
Top answer
The graph (what kind of graph? uk/data-visualisation/bar-charts-for-time-series/ ) compares the call volume in UK by three types of telephone service : local - fixed line, national and international - fixed line, and mobile phone over the eight-year period during 8 eight consecutive years from 1995 to 2002. ) period when the total number of minutes increased steadily from 1995-1999.
- The graph (what kind of graph?
- uk/data-visualisation/bar-charts-for-time-series/ ) compares the call volume in UK by three types of telephone service : local - fixed line, national and international - fixed line, and mobile phone over the eight-year period during 8 eight consecutive years from 1995 to 2002.
- ) period when the total number of minutes increased steadily from 1995-1999.
- Overall, in the initial five years, 1995-1999, call volume gradually increased in all categories.
- However, the quantity (wrong word) of local call by fixed line service gradually dropped while the two other services continued to rise in the latter years.
Get the Weekly English Kit 📬
New words, one handy idiom, and a 2-minute quiz — delivered to your inbox to keep your streak alive.
The graph (what kind of graph? https://style.ons.gov.uk/data-visualisation/bar-charts-for-time-series/ ) compares the call volume in UK by three types of telephone service: local - fixed line, national and international - fixed li
 Related Questions