
Please help me review this IELTS task 1
Summarise the information by selecting and reporting the main features, and make comparisons where relevant.
---------------------------------
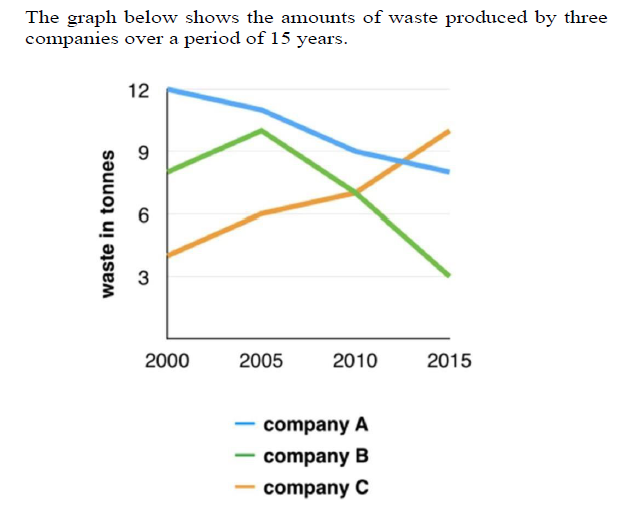
The line chart demonstrates the changes of the amount of waste released in three different companies from 2000 to 2015.
In general, the waste volume discarded by company A and B tended to decrease whereas the rubbish from company C increased remarkably throughout the 15-year period.
Looking into more detail, it is evident that the waste produced by company A was the largest source (12 tonnes) in 2000 but it steadily dropped to 8 tonnes after 15 years. Meanwhile, the company B’s waste output had risen in a short interval of 5 years, peaked at 10 tonnes in 2005 before making a considerable decline to a lowest level of 3 tonnes in the next 10 years.
At the beginning of the period, company C, in contrast, produced least amount of waste with 3 tonnes but its quantity of waste rose significantly and reached 10 tonnes in the final year to rank first among the three companies pushing company A to the second position.
Top answer
The line chart (Wrong word. There are pie charts and bar charts. ) demonstrates (Wrong word.
- The line chart (Wrong word.
- There are pie charts and bar charts.
- ) demonstrates (Wrong word.
- Use one of these verbs: show, give, compare, present, plot) the changes (wrong word.
- ) of the amount of waste released in three different companies from 2000 to 2015.
Get the Weekly English Kit 📬
New words, one handy idiom, and a 2-minute quiz — delivered to your inbox to keep your streak alive.
The line chart (Wrong word. There are pie charts and bar charts. There is no such thing as a line chart.) demonstrates (Wrong word. Use one of these verbs: show, give, compare, present, plot) the changes (wrong word. The values plotted
 Related Questions