
Please help me review this IELTS task 1
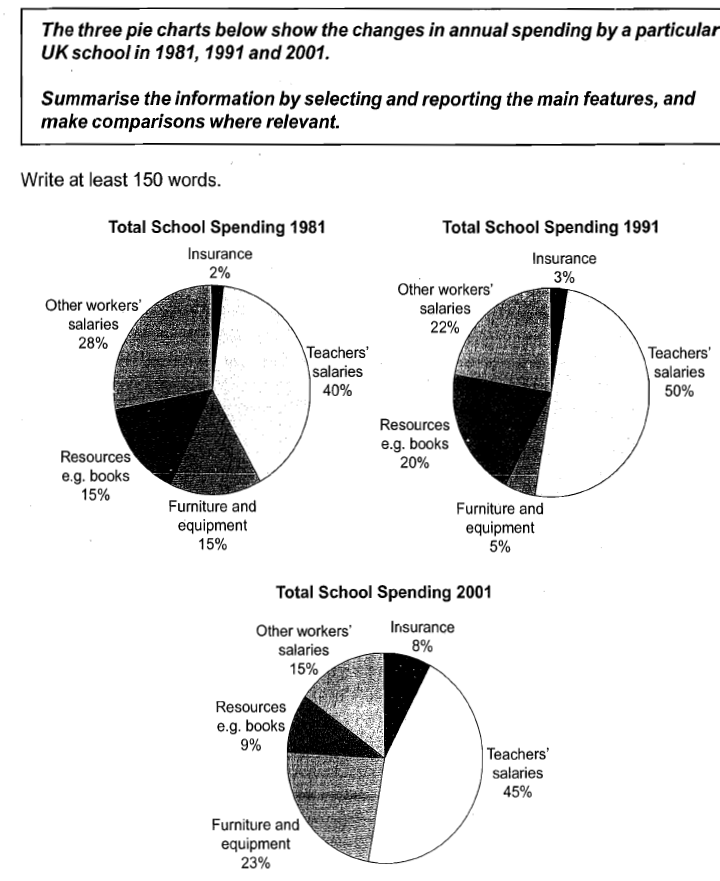
The charts give information about the changes of proportional expenditure at a UK school throughout three timepoints from 1981 to 2001.
Looking at the overall picture, it was noticeable that the salaries paid for teachers and other school workers occupied the largest portions of institutional budget (over 50%). The remains were spent on scholar resources or facilities and insurance.
From 1981 to 2001, there was a decreasing trend in workers' allowance while the salaries of the teaching staff remained high despite having a slight fluctuation ranging from 40-50%. Meanwhile, the insurance spending stood at 2% in 1981 but rose to 3% after the next 10 years and later reached the share of 8% in 2001.
In terms of educational materials such as books, it could be seen an increasing expense in 1981 and 1991 which took 15% and 20% of the budget, respectively, before witnessed a considerable drop to 9% in 2001. The percentage of money allocated for equipment and furniture hit the bottom at 5% in 1991 compared to 15% 10 years earlier. However, the spending for this issue recovered significantly to 23% of the total in 2001.
Top answer
The charts (What kind of charts are these? ) give information about (That is very very vague. What exactly is on these charts?
- The charts (What kind of charts are these?
- ) give information about (That is very very vague.
- What exactly is on these charts?
- ) from 1981 to 2001.
- (What are the three years?
Get the Weekly English Kit 📬
New words, one handy idiom, and a 2-minute quiz — delivered to your inbox to keep your streak alive.
The charts (What kind of charts are these? How many?) give information about (That is very very vague. What exactly is on these charts? ) the changes of proportional expenditure (That is not accurate.) at a UK school throughout three
 Related Questions