
Please, help me review my task 1 essay
The pie charts below show how teenagers in Japan and Australia spent their money in 2019.
Summarise the information by selecting and reporting the main features, and make comparisons where relevant.
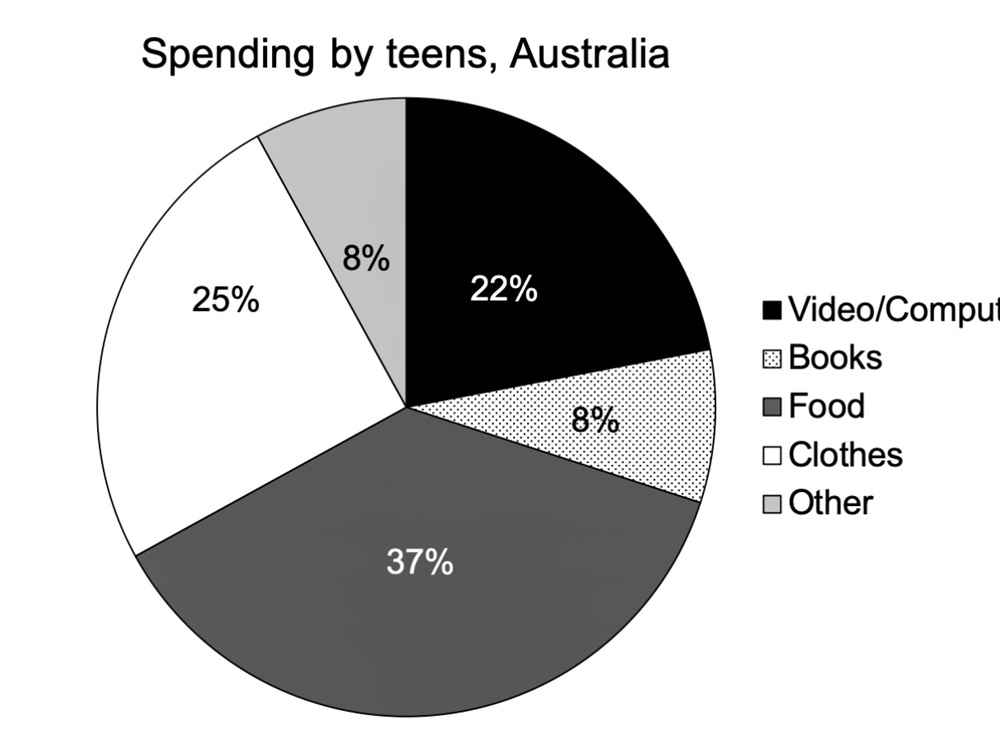
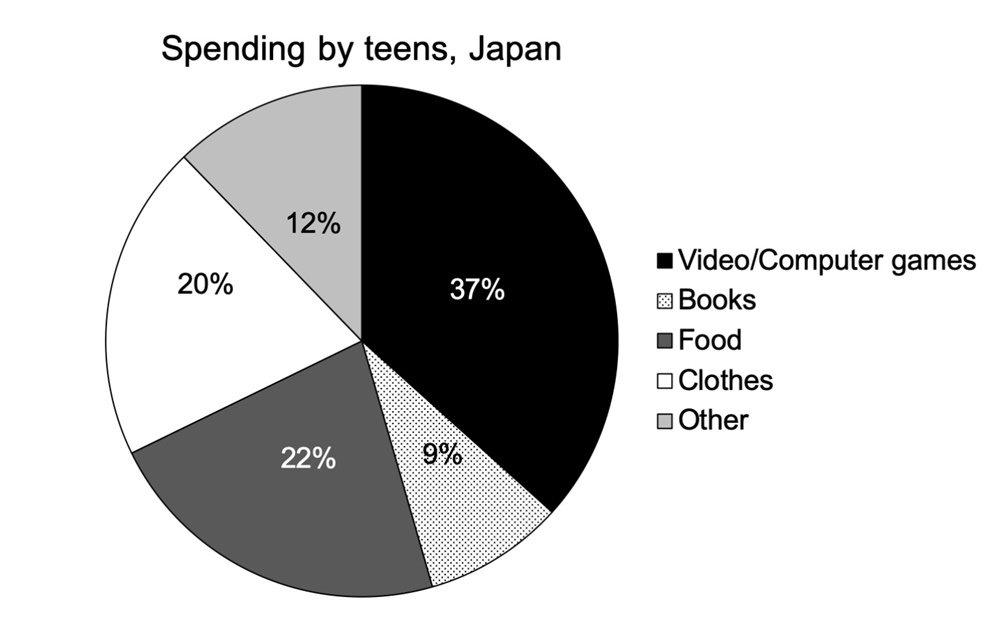
The pie charts illustrate the proportion of money that Japanese and Australian teenagers spent on five different items in the year 2019.
Teenagers in Japan mainly purchased video and computer games, whereas those in Australia favored food. In both groups, the lowest percentage of money was spent on books, though the 'other' category also had the lowest figure in Australia.
In 2019, Japanese teens used over one-third of their money to buy computer and video games, while the proportions of money spent on foodstuffs and clothing were 22% and 20%, all of which are more than two times higher than the figure for book (9%). Standing at just above one-fifth, the figure for 'other' was the second lowest after that of books.
The spending habit of teenagers in Australia in 2019 was different. Food represented 37% of their spending, making it their most purchased item. The figure for clothes, the second largest category, was one-quarter, and at 22%, video and computer games were a close third. Australian teens spent the least on books and other items, both of which accounted for 8% of their purchases.
Top answer
Do you still need help with that?
- Do you still need help with that?
Get the Weekly English Kit 📬
New words, one handy idiom, and a 2-minute quiz — delivered to your inbox to keep your streak alive.
 Related Questions