
Please help me review my report
The graph shows the percentage that women smokers occupies in two different continents in the period from 1950 to 200. It is clearly that the percentage of women smokers in Asia in 5 years first rose dramatically then fall sharply while that in Europe increased gradually.
From 1950 to 1970, the number of Asia women who smoke went up significantly and hit a peak of 19%, twice as much as that of Europe ones. However, since 1970, there was a gradual fall in the percentage of Asia women smokers from 19% to 16%, a drop of 3% while we can see a sharp increase in that of Europe ones to 17% in 2000, three times as much as that in 1950.
In 1990, it is the first time Europe women smokers’ percentage caught up with Asia one at 15%. 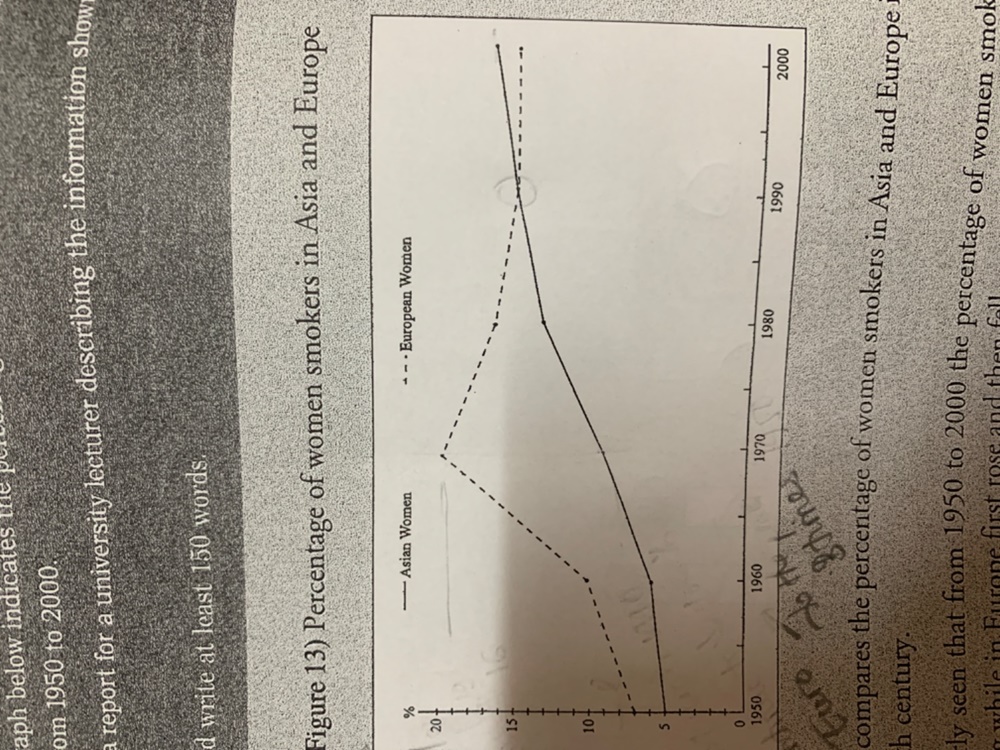 [[image:#rtts75ntxsxk.jpg|
1000px|
Top answer
The graph shows the percentage that women smokers occupies (wrong phrase) in two different continents in the period from 1950 to 200. ) T he percentage of women smokers in Asia in 5 years first rose dramatically then fall (wrong verb form) sharply while that in Europe , it increased gradually. From 1950 to 1970, the number (wrong word.
- The graph shows the percentage that women smokers occupies (wrong phrase) in two different continents in the period from 1950 to 200.
- ) T he percentage of women smokers in Asia in 5 years first rose dramatically then fall (wrong verb form) sharply while that in Europe , it increased gradually.
- From 1950 to 1970, the number (wrong word.
- A number is a value such as 43,987,452 or 35,987) of Asia women who smoke went up significantly and hit a peak of 19%, twice as much as that of Europe ones .
- However, since 1970, there was a gradual fall in the percentage of Asia women smokers from 19% to 16%, a drop of 3% while we can see a sharp increase in that of the Europe ans ones to 17% in 2000, three times as much as that in 1950.
Get the Weekly English Kit 📬
New words, one handy idiom, and a 2-minute quiz — delivered to your inbox to keep your streak alive.
The graph shows the percentage that women smokers occupies (wrong phrase) in two different continents in the period from 1950 to 200. It is clearly that (ungrammatical, also unnecessary words.) The percentage of women smokers in Asia in 5 years first rose dramatically then
 Related Questions