
Please, help me review my map description
The maps illustrate the development that took place in the waterfront area of a town between 2009 and 2014.
Overall, between those years, the area became more residential and less industrial. Another significant change was that a lot of trees were added to the area.
In 2009, dominating the southern section of the waterfront area was an industrial area, to the north of which were residential buildings and to the east of which was a sea running north-south and a swimming pool. The northern section, by contrast, had a circular footpath encircling a much smaller industrial area, a lake, and trees, and the footpath had two branches, one extending southwesterly and the other extending southeasterly. Furthermore, there was a swimming pool and fishing area east of this footpath, a convention center north of it, and a school west of it.
By 2014, however, the southern industrial area had been replaced by trees, residential buildings, and a university building. A footpath leading to a harbour was also constructed. Regarding the northern section, although the footpath, lake, trees, convention center, school, swimming pools, and fishing area remained the same, the industrial area was removed to provide space for a swimming pool.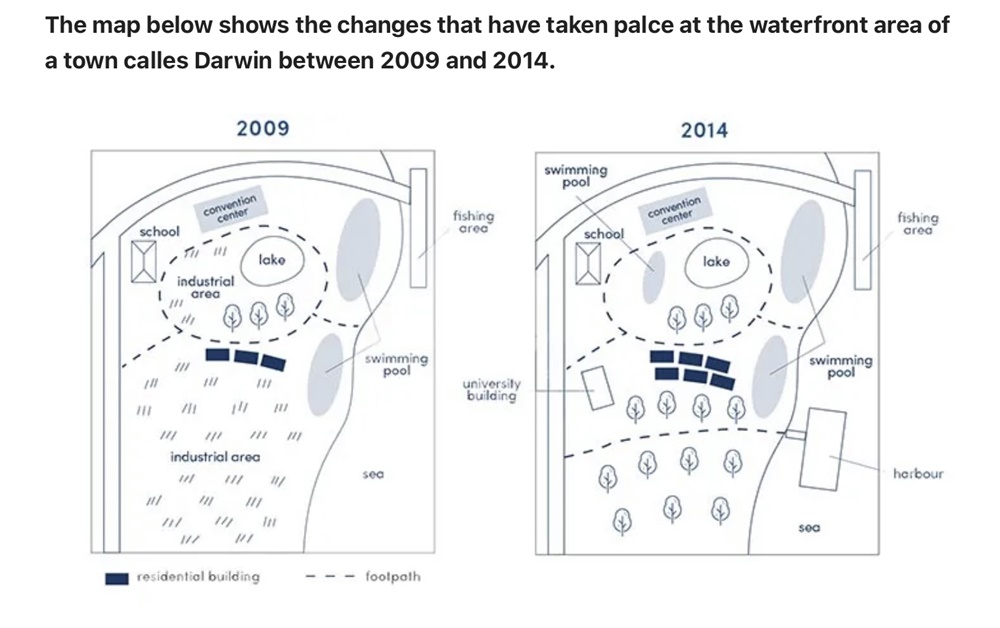
Top answer
The maps illustrate the development that took place in the waterfront area of a town between 2009 and 2014. Overall, [ 1 ] between those years, the area became more residential and less industrial , and Another significant change was that a lot of trees were added to it. the area.
- The maps illustrate the development that took place in the waterfront area of a town between 2009 and 2014.
- Overall, [ 1 ] between those years, the area became more residential and less industrial , and Another significant change was that a lot of trees were added to it.
- the area.
- In 2009, dominating the southern section of the waterfront area was an industrial area, to the north of which were with residential buildings north of it and to the east of which was a sea front to the east.
- It also had running north-south and a two swimming pool s .
Get the Weekly English Kit 📬
New words, one handy idiom, and a 2-minute quiz — delivered to your inbox to keep your streak alive.
The maps illustrate the development that took place in the waterfront area of a town between 2009 and 2014.
Overall, [ 1] between those years, the area became more residential and less industrial, and Another significant change was that a lot of trees were add
 Related Questions