
Please, help me review my essay
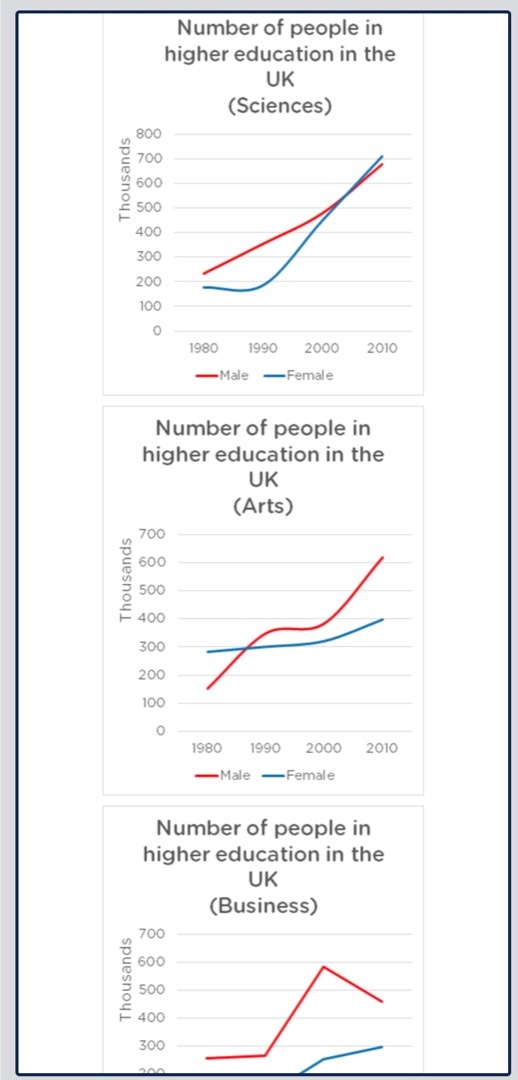
The line graphs illustrate the number of male and female enrollments that three education departments, namely sciences, arts, and business, had in the UK from 1980 to 2010.
Overall, the number of men and women accepted in the three faculties increased.
Women overtook men in the number of people in sciences and arts between the time period. Sciences had under 200,000 females in 1980, and this figure declined slightly before rising significantly, reaching just above 700,000 in 2010. The figure for males, on the other hand, increased throughout the period, though it ended the period with a slightly lower figure than that of males. Whereas the number of males enrolled in arts grew substantially from around 150,000 to above 600,000, which is a four-fold rise, that of females increased slightly but consistently.
However, the number of males accepted in business was higher than that of females throughout the given period, even though the figure for males experienced a decreased in the last 10 years. The figure for female enrollment climbed from 100,000 to 300,000. By 2010, there were roughly 450,000 males who registered in business.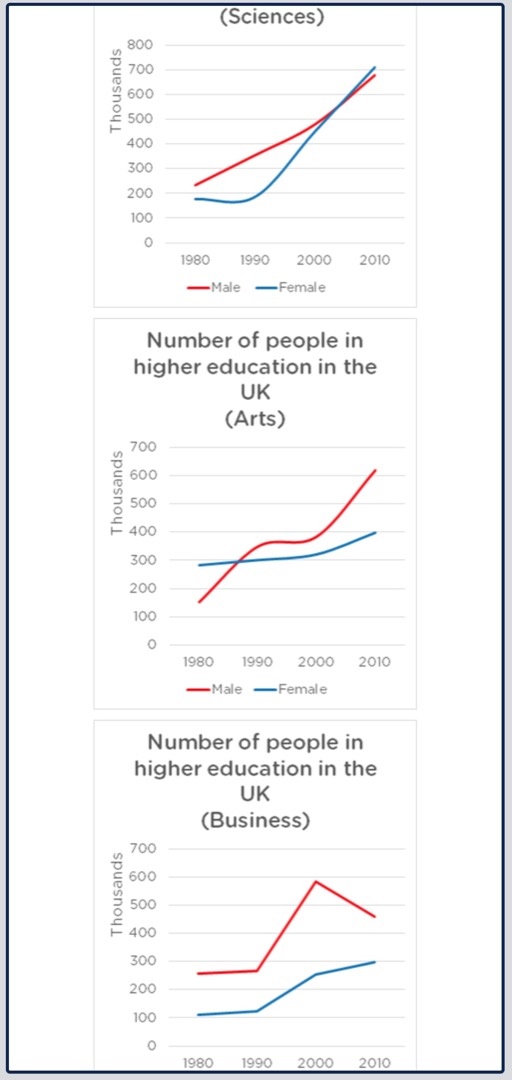
Top answer
Sorry, I forgot to add this: The graphs below show the number of enrolments into three higher education faculties in the UK. Summarise the information by selecting and reporting the main features, and make comparisons where relevant.
- Sorry, I forgot to add this: The graphs below show the number of enrolments into three higher education faculties in the UK.
- Summarise the information by selecting and reporting the main features, and make comparisons where relevant.
Get the Weekly English Kit 📬
New words, one handy idiom, and a 2-minute quiz — delivered to your inbox to keep your streak alive.
Sorry, I forgot to add this:
The graphs below show the number of enrolments into three higher education faculties in the UK.
Summarise the information by selecting and reporting the main features, and make comparisons where relevant.
 Related Questions