
Please help me review my essay
The table displays trends concerning the amounts of fast food consumed in Melbourne. Summarise the information by selecting and reporting the main features, and make comparisons where relevant
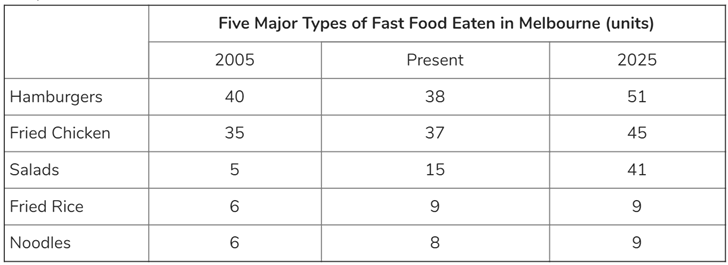
The table compares five different kinds of junk food (hamburger, fried chicken, salad, fried rice and noodles) in terms of consumption, measured in units, in Melbourne. Data are shown for one year in the past: 2005, the present year as well as a forecast in 2025.
In general, there is an increased intake of all categories compared to the year 2005. This pattern is projected to continue by 2025. Additionally, hamburgers will still have eaten most among kinds.
In 2005, hamburgers and fried chickens were by far the most favored fast foods, with 40 units and 35 units respectively, which were eightfold and sevenfold as much as the least, salads. Fried rice and noodles consumption were also pale in comparison, 6 units for each type.
At present, the number of eaten hamburgers is decreasing slightly by 2%, followed by a projection as surging to the peak at 51 units by 2025. However, the reverse is true for the four remaining kinds. Fried chickens continue a positive trend with a predicted increase of 10 units, while the number of consumed salads triple right now and will skyrocket to 41 units. Fried rice and noodles numbers will have slight increments of 3 units in 2025
Get the Weekly English Kit 📬
New words, one handy idiom, and a 2-minute quiz — delivered to your inbox to keep your streak alive.
 Related Questions