
Please help me in checking task 1 ielts
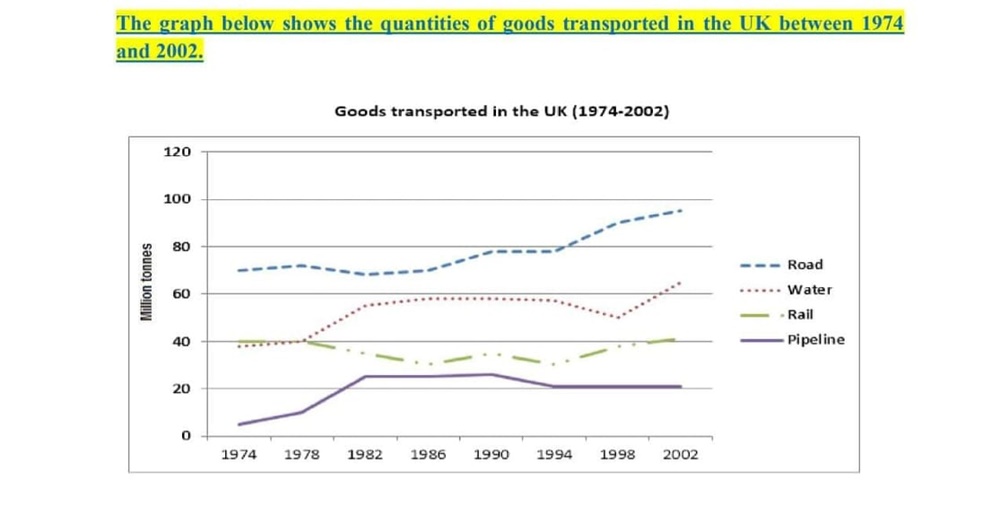
The graph gives information about how goods were transported by four specific means with the number of products delivered in the UK during the time from 1974 to 2002.
Overall, it can be seen that Britain witnessed an upward trend in most transport types. Moreover, rail is the only transportation type that remains stable in quantities at the end of the period.
Starting with the most common types, transportation by roads accounted for the most quantities in 1974 with nearly 70 million tonnes. Despite a slight decrease in 8 years after, it gradually rose by 80 million tonnes for the next 12 years before witnessing a surge of 100 million tonnes in the final year. Regarding pipeline delivery, there is a dramatic growth in the quantity of products with over 20 million in the first 8 years. Prior to 1990, it remained flat until it fell and then levelled off from the late 1990’s onwards.
Turning to water and rail transportation, they started at the same level of quantity about 40 million tonnes until 1978. In the next four years, while water transportation significantly increased to nearly 60 million tonnes, there was a minimal drop in the quantity of goods transported by rail to lower than 35 million tonnes. By 1994, both of two types fluctuated around 60 and 30 million tonnes of goods respectively .The figure of quantity delivered by water suddenly dropped to 50 million tonnes before considerably rising to over 60 million in 2002 whereas the rail gradually climb to its initial level in the same year.
Get the Weekly English Kit 📬
New words, one handy idiom, and a 2-minute quiz — delivered to your inbox to keep your streak alive.
 Related Questions