
Please help me ielts writing task 1
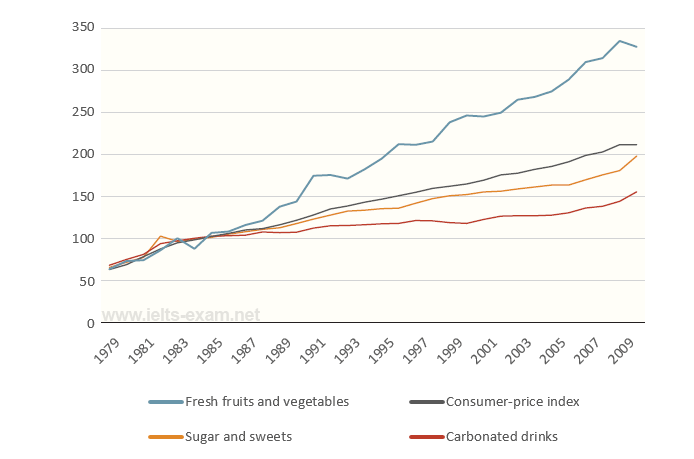
The line graph reveals changes in the price of fresh fruits and vegetables, sugars and sweets, and carbonated drinks, compared with the consumer price index over the 30-year period from 1979 to 2009.
The relative price changes for all three categories had been similar and closed to the consumer price index until 1987, and then the trend of these three categories were completely different.
Between 1979 and 1987, changes in the price of these three categories and the consumer price index were over 40. After 1987, although all of them were increasing, the prices for fruits and vegetables were always higher than the price index. While sugar and sweets and soft drinks remained lower than the price index till 2009.
The price’s growth rate of fruits and vegetables fluctuated during the 30-year period, and it reached a peak at roughly 340 in 2008. After that, there was a slightly decrease in the following year. On the other hand, both sugar and sweets, and carbonated drinks were growing steadily and continued rising in the year 2009.
Thank you so much!
Top answer
The line graph shows the changes in the price of fresh fruits and vegetables, sugars and sweets, and carbonated drinks, compared with the consumer price index (Note that the Consumer Price Index is usually referred to by its acronym, CPI . ) over the 30-year period from 1979 to 2009. The relative price changes for all three categories had been similar and closed to the consumer price index until 1987, and then t he trend of these three categories were completely different.
- The line graph shows the changes in the price of fresh fruits and vegetables, sugars and sweets, and carbonated drinks, compared with the consumer price index (Note that the Consumer Price Index is usually referred to by its acronym, CPI .
- ) over the 30-year period from 1979 to 2009.
- The relative price changes for all three categories had been similar and closed to the consumer price index until 1987, and then t he trend of these three categories were completely different.
- (That is not what the graph shows us.
- The trends were the same, that is upwards or increasing.
Get the Weekly English Kit 📬
New words, one handy idiom, and a 2-minute quiz — delivered to your inbox to keep your streak alive.
The line graph shows the changes in the price of fresh fruits and vegetables, sugars and sweets, and carbonated drinks, compared with the consumer price index (Note that the Consumer Price Index is usually referred to by its acronym, CPI. ) over the 30-year period from 1979 to 2009.
The relative price changes for all three categories had been similar and
 Related Questions