
Please help me highlight my IELTS Writing Mistakes. Thank you very much
Topic: The charts below show the results of a questionaire that asked visitors to the Parkway hotel how they rated the hotel’s customer service. The same questionaire was given to 100 guests in the years 2005 and 2010.
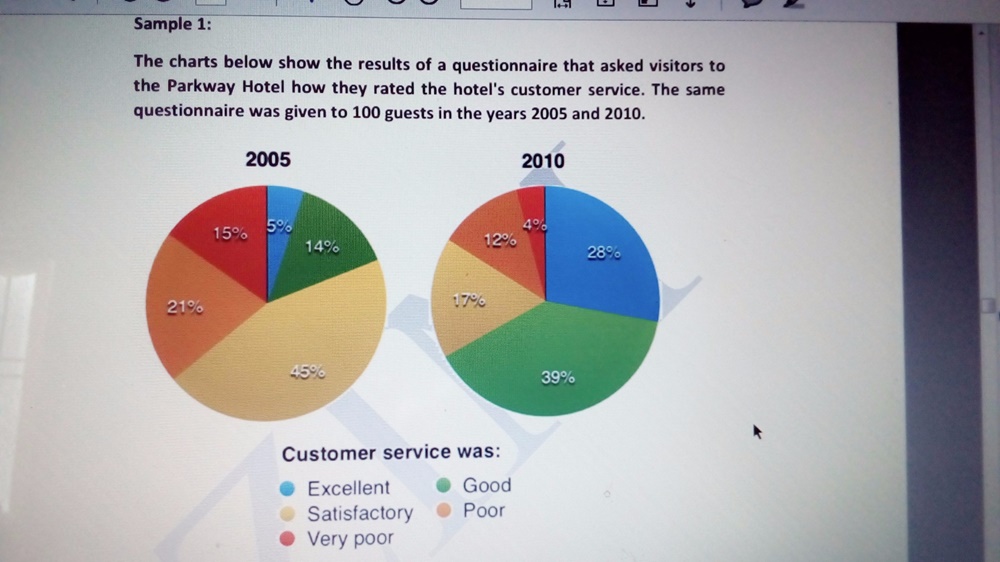
The pie charts illustrate the results of a written list of the same questions that were answered by 100 visitors to the Parkway hotel how they assess the hotel’s customer service in 2005 and 2010. In general, most of customer evaluated the service was so poor and satisfactory in 2005 while the majority customer rated the service as good or excellent in 2010.
Comparing the positive assessment in 2005 and 2010, it can be seen that the smallest percentage of customer’s valuation was excellent at 5% in 2005 and then this figure was reported to reach over five as many as the percentage of this rate at 28% in 2010. Moreover, while the number of travellers described customer service was good just at 14% in 2005, this percentage tended to increase considerable to 39% five years later.
With the negative valuation, the proportion of customer who responded the Parkway hotel service was poor had mitigated from 2005 to 2010 ( 21% and 12% respectively). Likewise, the percentage of those travellers thought the service to be very poor dropped quickly from 15% to 4% over 5 years period. Finally, these visitors who felt satisfactory declined slightly from 45% to 39% over the past five years represented the quality hotel service has became better than in the past.
Top answer
The pie charts illustrate the results of a written list of the same questions that were answered by 100 visitors to the Parkway h otel how they assess the hotel’s customer service in 2005 and 2010. In general, most of customer evaluated the service was so poor and satisfactory in 2005 while the majority customer rated the service as good or excellent in 2010. ) in 2005 and 2010, it can be seen that the smallest percentage of (missing word) customer’s valuation was excellent at 5% in 2005 and then this figure was reported to reach over five as many as the percentage of this rate at 28% in 2010.
- The pie charts illustrate the results of a written list of the same questions that were answered by 100 visitors to the Parkway h otel how they assess the hotel’s customer service in 2005 and 2010.
- In general, most of customer evaluated the service was so poor and satisfactory in 2005 while the majority customer rated the service as good or excellent in 2010.
- ) in 2005 and 2010, it can be seen that the smallest percentage of (missing word) customer’s valuation was excellent at 5% in 2005 and then this figure was reported to reach over five as many as the percentage of this rate at 28% in 2010.
- Moreover, while the number of travellers described customer service was good just (...
- ) at 14% in 2005, this percentage tended to increase considerable to 39% five years later.
Get the Weekly English Kit 📬
New words, one handy idiom, and a 2-minute quiz — delivered to your inbox to keep your streak alive.
The pie charts illustrate the results of a written list of the same questions that were answered by 100 visitors to the Parkway hotel how they assess the hotel’s customer service in 2005 and 2010. In general, most of customer evaluated the service was
 Related Questions