
Please Help Me Highlight My IELTS Writing Mistakes
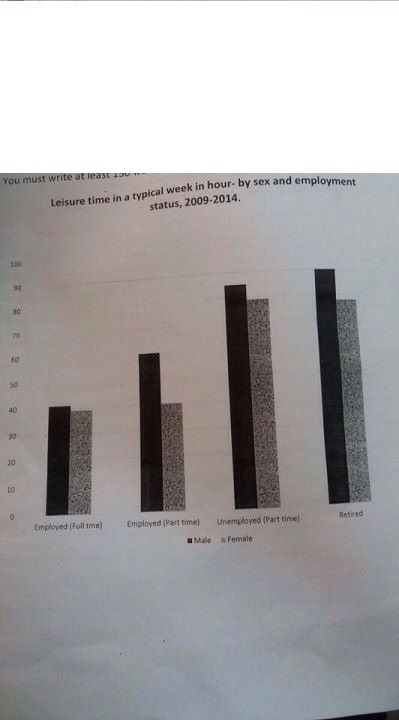
The bar chart compares the amount of spare time that men and women employees had in a typical day between 2009 and 2014.
As can be seen from the graph, in unemployment and retired categories, both sexes enjoyed huge amount of leisure hours in a typical week while the figures for full-time employees was significantly less.
During the time between 2009 and 2014, among the full-time employed people, both men and women had about 40 hours of free time on an average per week compared to the figures for retirement and joblessness was at much higher. Part-time unemployed and retired people had the longest period for leisure activity both for men and women and men had a bit more hours than the women, with being about 78 to 90 hours per week.
However, there was a considerable difference in the figure for part-time employees. Male spent more 20 hours of their leisure time than female, at 60 hours and 40 hours respectively. According to the chart, it seems that women have the recreation time less than men because of housekeeping which are often depend on female.
Thank you very much ^^
Top answer
I have commented on several of your essays. You did not reply to them, or ask any questions.
- I have commented on several of your essays.
- You did not reply to them, or ask any questions.
Get the Weekly English Kit 📬
New words, one handy idiom, and a 2-minute quiz — delivered to your inbox to keep your streak alive.
I have commented on several of your essays. You did not reply to them, or ask any questions.
 Related Questions