
Please help me correct this writing task 1. Many thanks!!!!
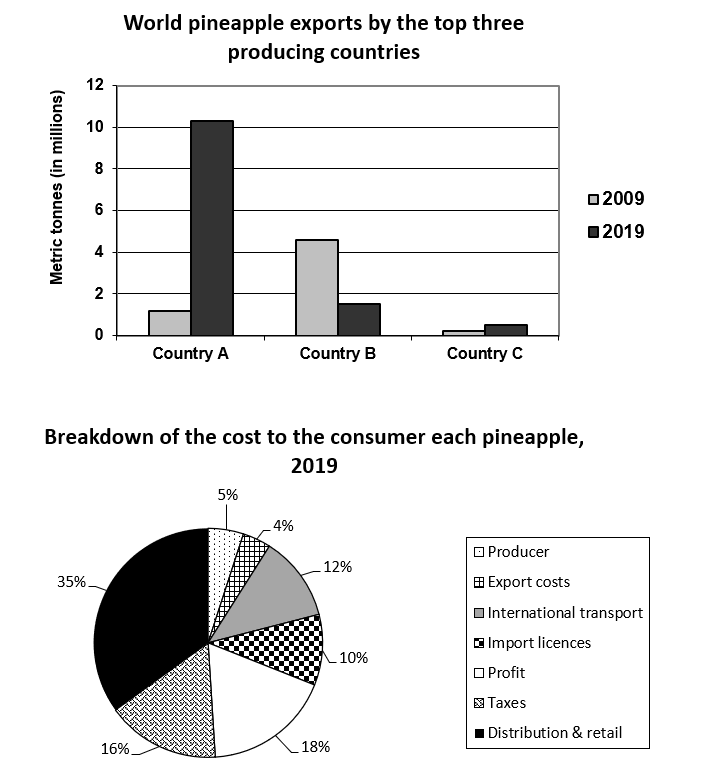
The charts show world pineapple exports by the top three pineapple-producing countries in 2009 and 2019, and a breakdown of the cost to the consumer of each pineapple in 2019.
Summarise the information by selecting and reporting the main features, and make comparisons where relevant.
The two charts depict the number of globally exported pineapples, produced in three nations, ranked as top three between 2009 and 2019, and proportions of the price to each pineapple consumption.
Overall, the number of pineapples exported in country C was extremely low. While country A exported the fruit in 2019 the most compared with three nations. From the second chart, distribution and retail accounted for the most proportion as opposed to other categories, meanwhile; producer and export costs made up least.
In 2009, the number of exports in country B was represented largest among the three nations, at over 4 million while country C gained least, at nearly 0,1 million. In 2019, the data for exports in country A predominated other nations, at considerably 10 million. Conversely, the values for countries B and C had lows of 0,8 and 0,3 million respectively.
Regarding the pie chart, there was a significant percentage in distribution and retail, at 35 percent. Conversely, producer and export costs occupied modestly, at 5 percent and 4 percent respectively. Other categories namely taxes and profit together summed 34 percent, sharing the same value as distribution, at 16 percent for taxes and 18 percent for profit.
Top answer
The charts show world pineapple exports by the top three pineapple-producing countries in 2009 and 2019, and a breakdown of the cost to the consumer of each pineapple in 2019. Summarise the information by selecting and reporting the main features, and make comparisons where relevant. The two charts depict the number of globally exported pineapples, produced in three nations, ranked as top three between 2009 and 2019, and proportions of the price to each pineapple consumption.
- The charts show world pineapple exports by the top three pineapple-producing countries in 2009 and 2019, and a breakdown of the cost to the consumer of each pineapple in 2019.
- Summarise the information by selecting and reporting the main features, and make comparisons where relevant.
- The two charts depict the number of globally exported pineapples, produced in three nations, ranked as top three between 2009 and 2019, and proportions of the price to each pineapple consumption.
- Overall, the number of pineapples exported in country C was extremely low.
- While country A exported the fruit in 2019 the most compared with three nations.
Get the Weekly English Kit 📬
New words, one handy idiom, and a 2-minute quiz — delivered to your inbox to keep your streak alive.
The charts show world pineapple exports by the top three pineapple-producing countries in 2009 and 2019, and a breakdown of the cost to the consumer of each pineapple in 2019.
Summarise the information by selecting and reporting the main features, and make comparisons where relevant.
The two charts depict the number of globally exported pineapples, produced in three n
The two (What kind of charts?) charts depict the number of globally exported pineapples, (That is not correct. There are no counts of fruit.) produced in three nations, (What are these nations?) ranked as top three between 2009 and 2019, and proportions of the price to each pineapple con
 Related Questions