
Please help me correct this writing task 1. Many thanks!!!!
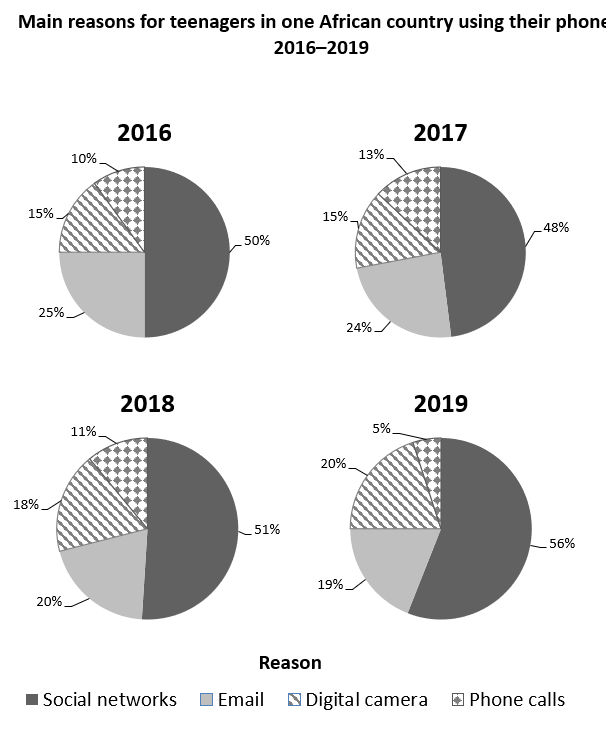
The chart shows the results of surveys in one African country asking teenagers the main reasons for using their phones between 2016 and 2019.
Summarise the information by selecting and reporting the main features, and make comparisons where relevant.
The pie charts depict the percentage of respondence from surveys conducted in a particular African nation in regard to reasons for phone usage namely social networks, email, digital camera, and phone calls. The data is shown from 2016 to 2019
Overall, the percentage of Social networks accounted for half throughout the period. Whilst, the figures for phone calls seen from 4 charts were ranked as the least.
As it can be seen from the charts, between 2016 and 2019, there were overwhelming proportions of Social networks in comparison with other categories, at 50 percent, 48 percent, 51 percent, and a hefty 56 percent respectively. Conversely, for Phone calls, the data occupied the least amount, initiating modestly at 10 percent in 2016, but eventually, there were only one in 20 people using phones for calling.
Additionally, there was a quarter of email usage in 2016, nonetheless, the data was less than 6 percent, at 19 percent in 2019. Meanwhile, there was an opposite trend in Digital camera which initially made up 15 percent in 2016, however; the value was 5 percent more, at 20 percent in the last year.
Top answer
Please post essays, paragraphs, dialogues and other writing in the essay forum so a moderator does not have to move your post. Click on this link: Next, tap on the green button "write a new post"
- Please post essays, paragraphs, dialogues and other writing in the essay forum so a moderator does not have to move your post.
- Click on this link: Next, tap on the green button "write a new post"
Get the Weekly English Kit 📬
New words, one handy idiom, and a 2-minute quiz — delivered to your inbox to keep your streak alive.
The (how many?) pie charts depict the percentage of respondence (Respondents, participants) from surveys conducted in a particular African nation in regard to reasons for phone usage (That is not accurate) namely social net
Here is a sample essay for you to study.
The pie charts show the results of four surveys of African teens in one country concerning the primary way they use their mobile phones. Surveys were done annually between 2016 and 2019, and participants could choose from these four categories: social networking, email, phone calls and taking photos.
Overall, about three-quarters m
 Related Questions