
Please help me correct this writing task 1. Many thanks!!!!
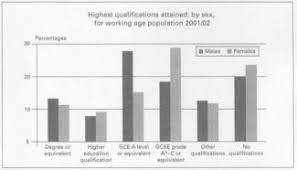
The bar chart shows the highest qualification attained by sex for the working-age population in Wales in 2001/02
Summarize the information by selecting and reporting the main features, and make comparisons where relevant
The bar chart compares the percentages of males and females belonging to the working-age group who obtained the highest qualification in Wales. The data is shown in the two years 2001 and 2002.
Overall, the proportion of men who succeeded in having GCE A level or equivalent significantly doubled that of women. Whilst, there were much more females in percentage receiving GCSE grade A* than men did. Additionally, ratios of men other indicators have slightly occupied more as opposed to that of women and vice versa.
Initially, there was a hefty 28 percent of men achieving GCE A level or equivalent in comparison with only a mere 15 percent of women. Conversely, in GCSE, the proportion of females having A* -C or equivalent predominated that of men, 28 percent and 18 percent respectively. The ratio of men in other qualifications made up by over 12 percent merely higher than that of women, at over 10 percent. With no qualifications, there was an overwhelming proportion of females, by nearly 25 percent while the value of males was 5 percent fewer, at exactly 20 percent. Furthermore, there was a mere disproportion of both sexes progressing towards higher education, the data of the two were both under 10 percent, more or less 9 percent for women and 7 percent for men.
Top answer
I am sorry for attaching the blurred image. I enclose here another better one. Thank you!!
- I am sorry for attaching the blurred image.
- I enclose here another better one.
- Thank you!!
Get the Weekly English Kit 📬
New words, one handy idiom, and a 2-minute quiz — delivered to your inbox to keep your streak alive.
It really helps to know the British Education system to understand this chart.
It is completely foreign to Americans!
The General Certificate of Secondary Education (GCSE) was first introduced in 1986. GCSE courses are taught in the last two years of secondary school, of the National Curriculum in England.
A-Levels, short for Advanced Levels, are a higher qualification than
The bar chart compares the percentages of working-age males and females belonging to the working-age group who obtained the highest qualification (That is not correct. The bar chart also plots those with no qualifications at all!) in Wales. The data is shown in the two years
 Related Questions