
Please help me correct this IELTS writing task 1 below. Thank you
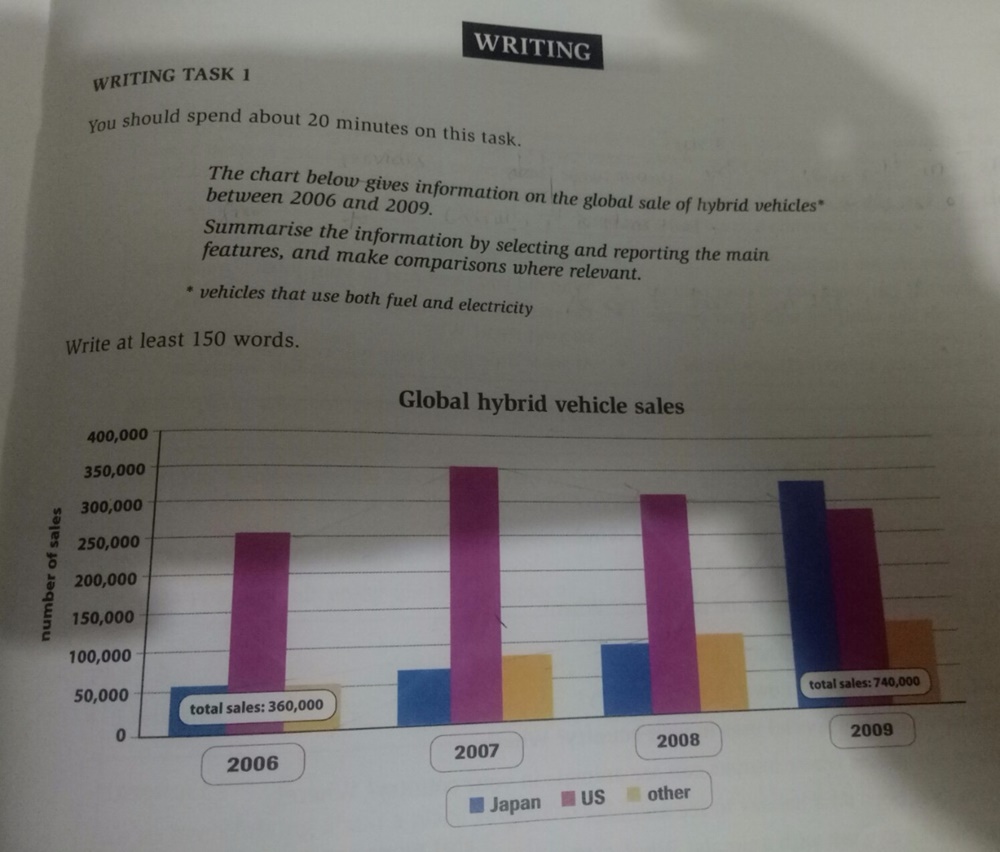
The given chart provides information about how many hybrid vehicles were sold in Japan, the US and the rest of the world, over the period of three years from 2006 to 2009. Overall, what stands out from the chart is that the total global sales increased more than double during the three-year period. Another interesting point is that sales in Japan were much lower than the US at the start but in 2009, sales in Japan increased dramatically and became the country where vehicles were sold the most.
As can be seen from the chart, in 2006, the USA was the country where the most vehicles were sold, with more than 250,000, while only more than 50,000 hybrid vehicles were sold in Japan and more than 50,000 were sold in the rest of the world. In 2007, sales in America increased significantly to 350,000 vehicles but after that there was a steady fall every year to about 280,000 in 2009. On the other hand, in Japan, there was a gradual increase in sales to 80,000 in 2008 but then they rose dramatically to about 330,000 in 2009. Sales in the rest of the world went up steadily from about 50,000 in 2006 to 120,000 in 2009.
WRITE DESCRIPTION HERE
Top answer
The given chart provides information about how many hybrid vehicles were sold in Japan, the US and the rest of the world, over the period of three years from 2006 to 2009. Overall, what stands out from the chart is that the total global sales increased more than double during the three-year period. Another interesting point is that sales in Japan were much lower than the US at the start but in 2009, sales in Japan increased dramatically and became the country where vehicles were sold the most.
- The given chart provides information about how many hybrid vehicles were sold in Japan, the US and the rest of the world, over the period of three years from 2006 to 2009.
- Overall, what stands out from the chart is that the total global sales increased more than double during the three-year period.
- Another interesting point is that sales in Japan were much lower than the US at the start but in 2009, sales in Japan increased dramatically and became the country where vehicles were sold the most.
- As can be seen from the chart, in 2006, the USA was the country where the most vehicles were sold, with more than 250,000, while only more than 50,000 hybrid vehicles were sold in Japan and more than 50,000 were sold in the rest of the world.
- In 2007, sales in America increased significantly to 350,000 vehicles but after that there was a steady fall every year to about 280,000 in 2009.
Get the Weekly English Kit 📬
New words, one handy idiom, and a 2-minute quiz — delivered to your inbox to keep your streak alive.
The given chart provides information about how many hybrid vehicles were sold in Japan, the US and the rest of the world, over the period of three years from 2006 to 2009. Overall, what stands out from the chart is that the total global sales increased more than double during the three-year period. Another interesting point
We can't help you much if we can't see what you are writing about. Please upload an image.
The given chart (What kind of chart?) provides information about (What kind of information? Be precise. ) how many hybrid vehicles were sold in Japan, the US and the rest of the world, over the period of three years in each year from 2006 to 2009. (There are four years shown.)
The
 Related Questions