
Please help me correct my writing IELTS Task 1/Bar chart. Thank you very much
The bar chart gives information about the movement of three economic sectors in the UK over the 10-year period.
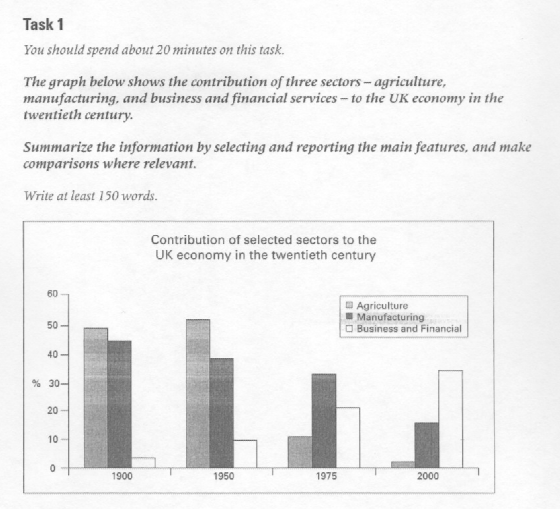
Overall, the trends in the agricultural and manufacturing sectors were downward, whereas, the percentage of service activities increased significantly during that period.
In 1900, the agricultural sector made up to roughly 50%, remaining the highest portion in the U.K. economy. For 50 years later, that number was still unchanged while the proportion of the producing sector decreased steadily over a period of ten years.
However, from 1975 onwards, there was a dramatic increase in the percentage of business and financial activities, reaching nearly 40% in 2000. Whereas, the agricultural zone experienced a sudden fall in the total contribution from 1975 to 2000 before bottoming at only approximately 2% in the final year.
In conclusion, during that period there was a significant variation in the distribution of three ergonomic sectors in the UK, in particular, the service activities replaced the agriculture ones to achieve the most proportion.
Get the Weekly English Kit 📬
New words, one handy idiom, and a 2-minute quiz — delivered to your inbox to keep your streak alive.
 Related Questions