
Please help me correct my writing ielts task 1. Thank you very much.
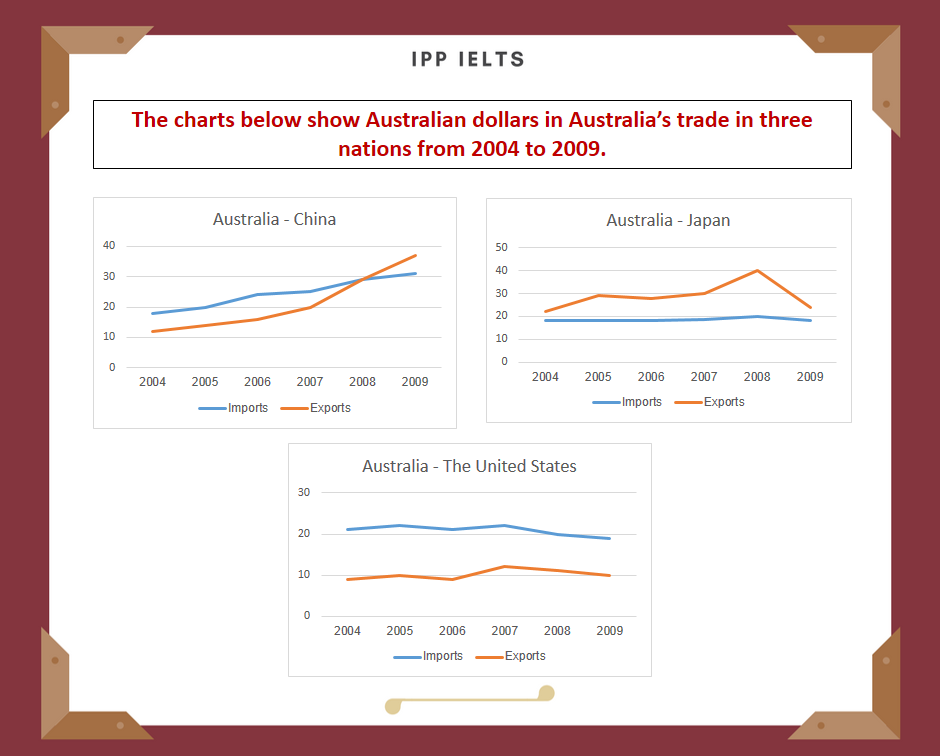
Given are the line graphs illustrating the statistics about Australia’s international trade in 3 nations (China, Japan and the US) from 2004 to 2009, measured by Australian dollars.
Overall, it can be easily seen that the trading value of both Japan and China is able to bring the benefits for Australia with significant growth whilst USA’s remained relatively constant.
In 2004, imports from the US were counted by 10 billion of dollars and had an upward trend to 11 billion dollars by 2009. The value of exports was seemed to be higher, at around 30 billion dollars over the 5-year-period.
On the contrary, Japan’s imports had higher value than exports to that country at 19 billion dollars in the first year then reached a peak of 40 billion dollars in the year of 2008, followed by a slight decrease in the final year. Although the value of exports initially stood at lower point in 2004 but fluctuating trivially between 2004 and 2009 (10 and 14 billion of dollars respectively).
About China’s figure, the imports value which hit a low from 10 billion dollars to the highest point known as 40 billion of dollars over the period, overtaking the value of exports to that nation. However, the export trade also witnessed an important increase, rising to 31 billion dollars by the end of the period.
Top answer
) the (How many) line graphs illustrating (wrong word) the statistics about (That is very unclear and vague. ) nations (China, Japan and the US) from 2004 to 2009, measured in by (wrong word) Australian dollars. Suggested opening: The three line graphs plot the value of Australia's exports and imports with three nations ( Japan, the United States, and China, respectively) between 2004 and 2009.
- ) the (How many) line graphs illustrating (wrong word) the statistics about (That is very unclear and vague.
- ) nations (China, Japan and the US) from 2004 to 2009, measured in by (wrong word) Australian dollars.
- Suggested opening: The three line graphs plot the value of Australia's exports and imports with three nations ( Japan, the United States, and China, respectively) between 2004 and 2009.
- The values are given in Australian dollars.
- I did not see a legend on the Y-axis of "billions" You did not include all the instructions.
Get the Weekly English Kit 📬
New words, one handy idiom, and a 2-minute quiz — delivered to your inbox to keep your streak alive.
Given are (do not use "given, provided, above or below" for the infographic.) the (How many) line graphs illustrating (wrong word) the statistics about (That is very unclear and vague. What exactly is on the graphs?)
 Related Questions