
Please help me correct my writing
Topic: The graph below shows changes in global food and oil prices between 2000 and 2011
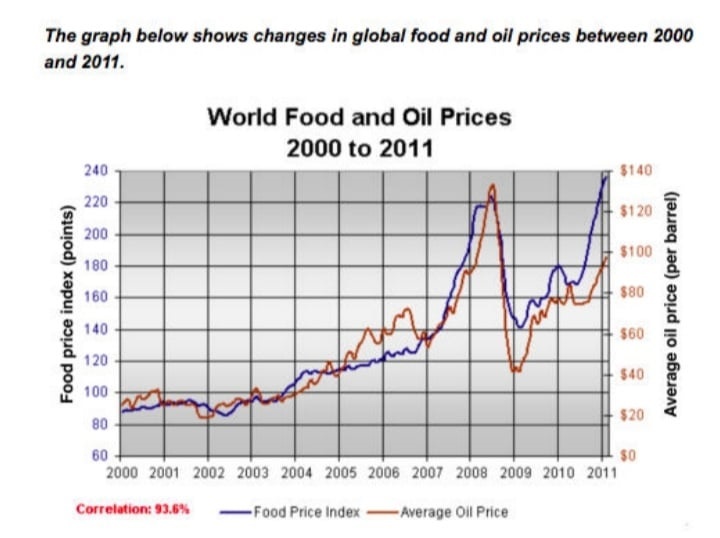
The line graph demonstrates the average price of world food and oil from 2000 to 2011.
As can be seen from the graph, both the price of food and oil witnessed upward trends over the given period.
In 2000, food prices index started at around 90 points while the average price of oil stood at roughly $30 per barrel. Between 2000 and 2003, all prices remain almost unchanged before rising dramatically over the subsequent 4 years.
Moreover, from 2007 to 2008 saw a sharp increase in both price of global food and oil, food price index was at 220 points and average oil price was reach a peek at approximately $130. Then, both commodities fell significantly, the price of food drop to 140 points, whereas oil price declined to just over $40. Finally, there was a dramatically climb in the price of global food and it reached a peek at 240 points, meanwhile the price of oil increased gradually to $100 per barrel for the rest of period.
Top answer
Read my advice for Task 1 essays. IELTS TASK 1: Hints, Tips And Advice Vocabulary Words For Task 1: Reference Post
- Read my advice for Task 1 essays.
- IELTS TASK 1: Hints, Tips And Advice Vocabulary Words For Task 1: Reference Post
Get the Weekly English Kit 📬
New words, one handy idiom, and a 2-minute quiz — delivered to your inbox to keep your streak alive.
The line graph demonstrates (poor verb choice. Read my advice) compares the average price of world food and oil from 2000 to 2011.
As can be seen from the graph, (Unnecessary verbosity. This has no significant information content. Delete. Read my advice.) both the
 Related Questions