
Please help me correct my paragraph!. Thank you so much!.
The summary of a survey on adult education is presented in 2 charts. The bar chart depicts the factors that make adults studying, while the pie chart indicates the opinion related to the cost sharing for adult education.
The bar chart demonstrates 40% of the responders supposed “interest in the subject” as the main reason why they decided to go to school. This factor was followed closely by the aim to gain qualifications with 38%. However, only 9% of the survey participants replied that they went to school just to meet people. This is the least popular reason among all given one.
According to the cost sharing of each course, the majority of fees should be covered by the individual with 40%, while 35% of the cost should be shared to employers. On the other hand, only 25% was expected to belong to the 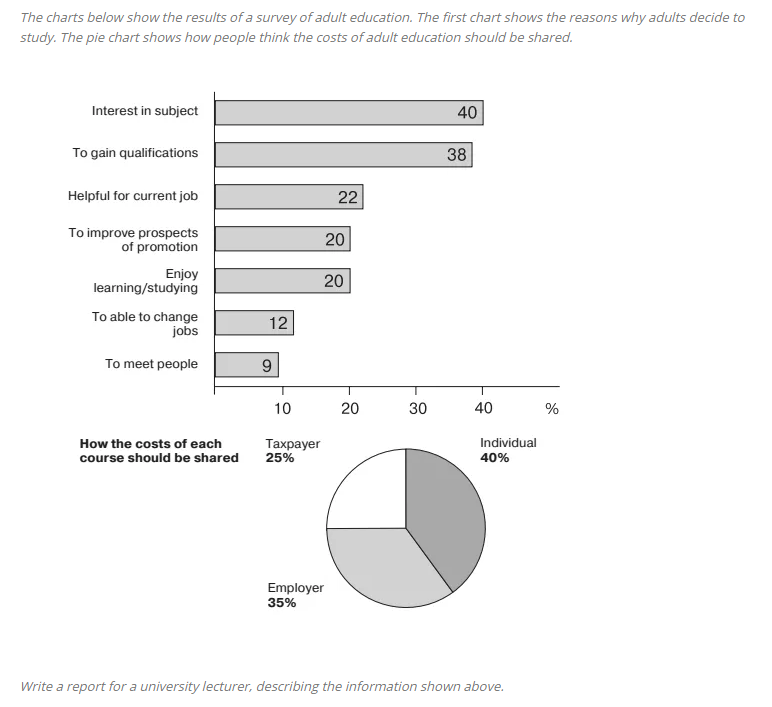
taxpayer.
In summary, the survey showed different opinions regarding the reasons and cost sharing for adult education.
Top answer
The summary of a survey on adult education is presented in two charts. ) related to the cost sharing of for adult education. The description of the figures is incomplete.
- The summary of a survey on adult education is presented in two charts.
- ) related to the cost sharing of for adult education.
- The description of the figures is incomplete.
- Give all the essential elements of the figures in the first paragraph: The summary of a survey on adult education is presented in a bar chart and a pie chart.
- The bar chart lists, in order, the number of responses in seven different categories describing the reasons why adults decide to enroll in adult education courses.
Get the Weekly English Kit 📬
New words, one handy idiom, and a 2-minute quiz — delivered to your inbox to keep your streak alive.
The summary of a survey on adult education is presented in two charts. (Write small numbers in words, unless you are citing a data point.) The bar chart depicts the factors that make adults studying, (ungrammatical) while the pie chart indicates the op
 Related Questions