
Please help me correct my essay
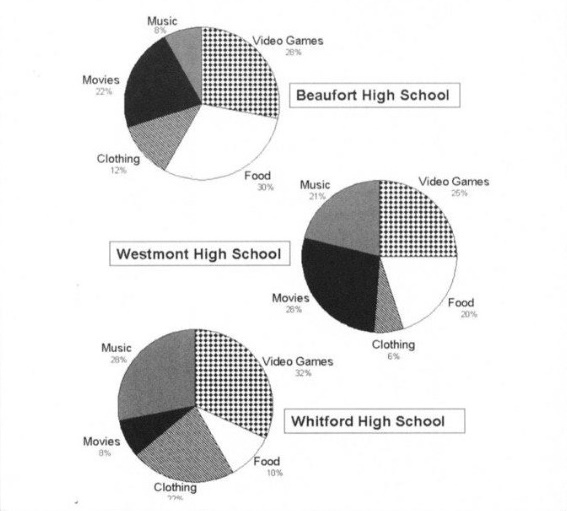
Topic: the charts below show what senior high school students in 3 different schools (Beaufort, Westmont and Whitford) spend their money on in 2005.
Summarise the information by selecting and reporting the main features, and make comparisons where relevant.
The three pie charts illustrate the proportion of senior student's expenditure from high schools namely Beaufort, Westmont and Whitford in 2005. Overall, there are 4 categories regarding video games, food, clothing, movies and music.
The expense on video games contributed for the second largest proportion in both Beaufort (28%) and Westmont (25%), whereas it was the most popular category in Whitford - over a third of the number. On the contrary, the proportion of food in Whitford only accounted for 10%, 2 times as low as that in Westmont and less than that in Beaufort for 3 times.
Similarly, the percentage of clothing in Whitford was 22%, almost doubled that in Beaufort and tripled that in Westmont. The proportion of expense on movies in Westmont and Whitford was equalled at 28%, in addition, the proportion of movies in Whitford and music in Beaufort hit a dip of 8%.
Top answer
You wrote less than the minimum of 150 words. You will lose points for that. Aim for 170-190 words in Task 1.
- You wrote less than the minimum of 150 words.
- You will lose points for that.
- Aim for 170-190 words in Task 1.
- Your essay is not well organized.
- IT is not clear how you divided paragraphs two and three.
Get the Weekly English Kit 📬
New words, one handy idiom, and a 2-minute quiz — delivered to your inbox to keep your streak alive.
You wrote less than the minimum of 150 words. You will lose points for that. Aim for 170-190 words in Task 1. Your essay is not well organized. IT is not clear how you divided paragraphs two and three.
The second paragraph should give two or three major observations. The third should give a few interesting details.
Please read my advice for Task 1 essays.
 Related Questions