
Please help me correct my essay
Topic: The table below shows the change in some household types in Great Britain from 1971 to 2007.
Summarize the information by selecting and reporting the main features, and make comparisons where relevant.
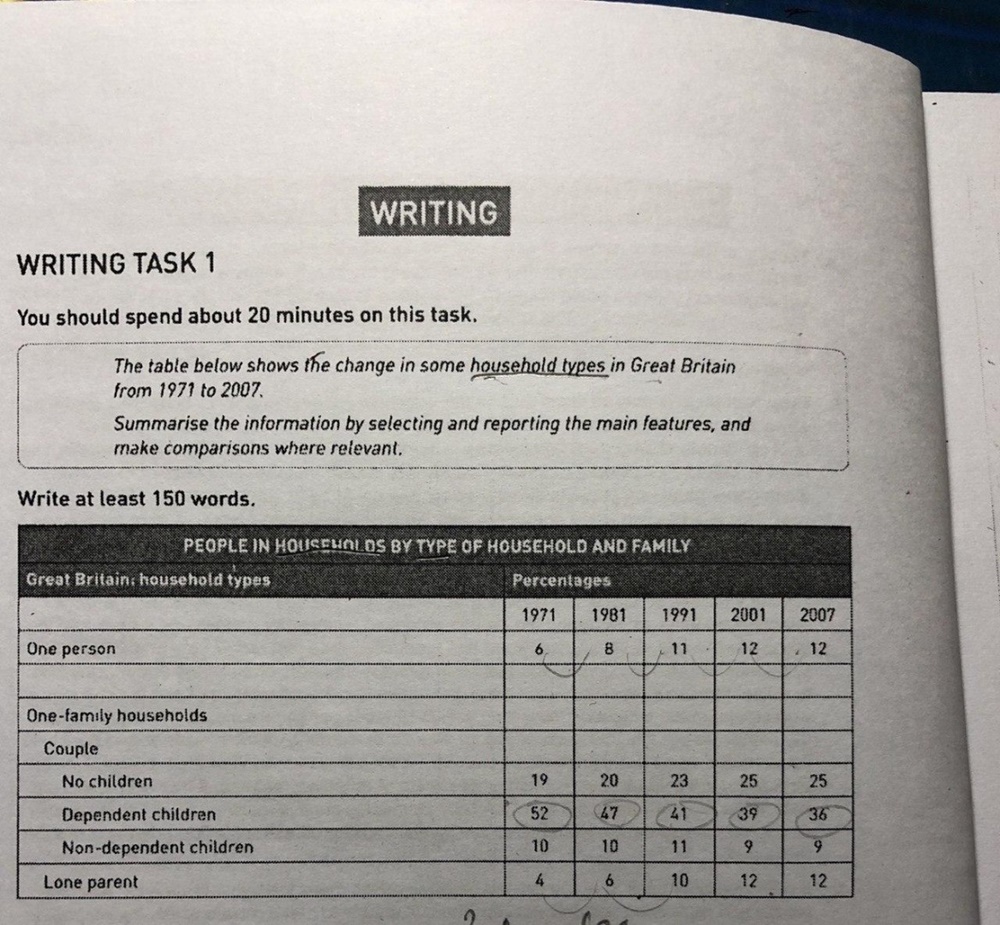
The below table represents the rate of people living in different models of households in Great Britain during the period of over three decades between 1971 and 2007. In general, there was a majority of one-family households regarding couple, compared to one person households.
As can be seen from the table, the percentage of households with dependent children contributed for over a half of the total number in 1971, it remained as the most popular modules among other households for 4 years later, despite the decline of 36% in 2007. There was a slight growth in one-person and lone parent households during this time. To be more specific, the proportion of both aforementioned types increased by 2% to 3% annually and reached the point of 12% in 2007. In addition, none-children households witnessed an insignificant rise, 6% in 5 years; similarly, families having independent children remained stable during three decades.
Top answer
The below (Do not use given, provided, above or below) table represents (wrong verb. For tables use "give, compare or list") the rate (wrong word. There are no rates in the table.
- The below (Do not use given, provided, above or below) table represents (wrong verb.
- For tables use "give, compare or list") the rate (wrong word.
- There are no rates in the table.
- A rate requires a divisor .
- g.
Get the Weekly English Kit 📬
New words, one handy idiom, and a 2-minute quiz — delivered to your inbox to keep your streak alive.
The below (Do not use given, provided, above or below) table represents (wrong verb. For tables use "give, compare or list") the rate (wrong word. There are no rates in the table. A rate requires a divisor. e.g. The rate of speed is 50 km / hour. The inter
 Related Questions