
Please help me correct and give a band for my IELTS writing task 1
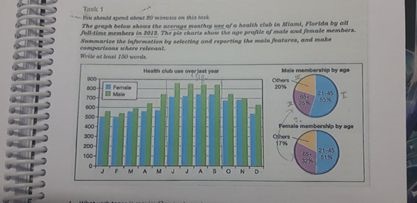
The graph below shows the average memberships of a health club in Miami over a year and the pie charts indicate their ages.
As we can see from the graph, the month when there are most people join the club in June with over 800 men and a little bit more than 700 women. The year with the least members joining the club in February, the number of men is just about 520 min and the number of women is also around 500. It is clear that the number of members of the club increases from January to June and hit a peak in June. And then it has a slight decrease to around 600 at the end of the year.
The two pie charts show the percentage of different ages group of the two genders. As we can see from the male’ age group. Half of the male members are ages from 21-45 years old, about 55%. The same figure can be seen in the female group, too. The difference between the two genders is that the number of male members who are over 65 is less than that of the female member by 7 percent.
In conclusion, the time the club is the most crowded is from June to August. And it seems that in the old age female consider health more than men.
Get the Weekly English Kit 📬
New words, one handy idiom, and a 2-minute quiz — delivered to your inbox to keep your streak alive.
 Related Questions