
Please help me check this essay
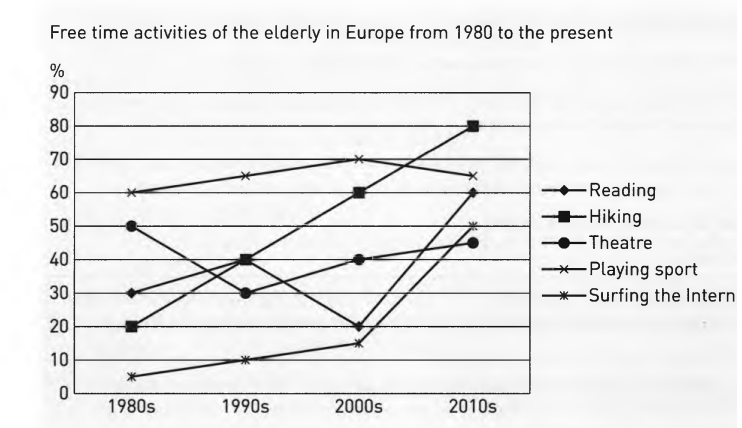
The line graph below illustrates the trend of five leisure activities of old people during 30 years from 1980. Generally, there was an increase in four activities, and especially hiking rose sharply from 20% to 80%, but going to the theater dropped in popularity slightly.
In the 1980s, almost all activities grew in popularity. However, the elderly going to the theater declined significantly from 50% to 30%, and this was only activity which became less famous. In the next decade, there was an opposite trend in watching films in the theater, and it gained 10% in popularity, whereas reading experienced an dramatic fall from 40% to 20%. The remaining activities continued to become more popular. In the last decade, there was a massive change in reading and surfing the Internet, and the percentage of the elderly doing these activities increased sharply from 20% to 60%, and the other was from about 15% to 50%. Playing sport dropped slightly in popularity but it was among the most popular overall and reached the peak in 2000 at 70%. Finally, the other activities still remained steady.
Top answer
Please read my advice for Task 1 essays. IELTS TASK 1: Hints, Tips And Advice Vocabulary Words For Task 1: Reference Post
- Please read my advice for Task 1 essays.
- IELTS TASK 1: Hints, Tips And Advice Vocabulary Words For Task 1: Reference Post
Get the Weekly English Kit 📬
New words, one handy idiom, and a 2-minute quiz — delivered to your inbox to keep your streak alive.
The line graph below (Do not use "given", "provided", "above " or "below") illustrates (poor word choice. What exactly is on this graph?) the trend (That is not plotted on the graph. What units of measure would "trend" be?) of fi
 Related Questions