
Please help me check my writing. Thank you all in advance. Could you tell me the band score I can get for this?
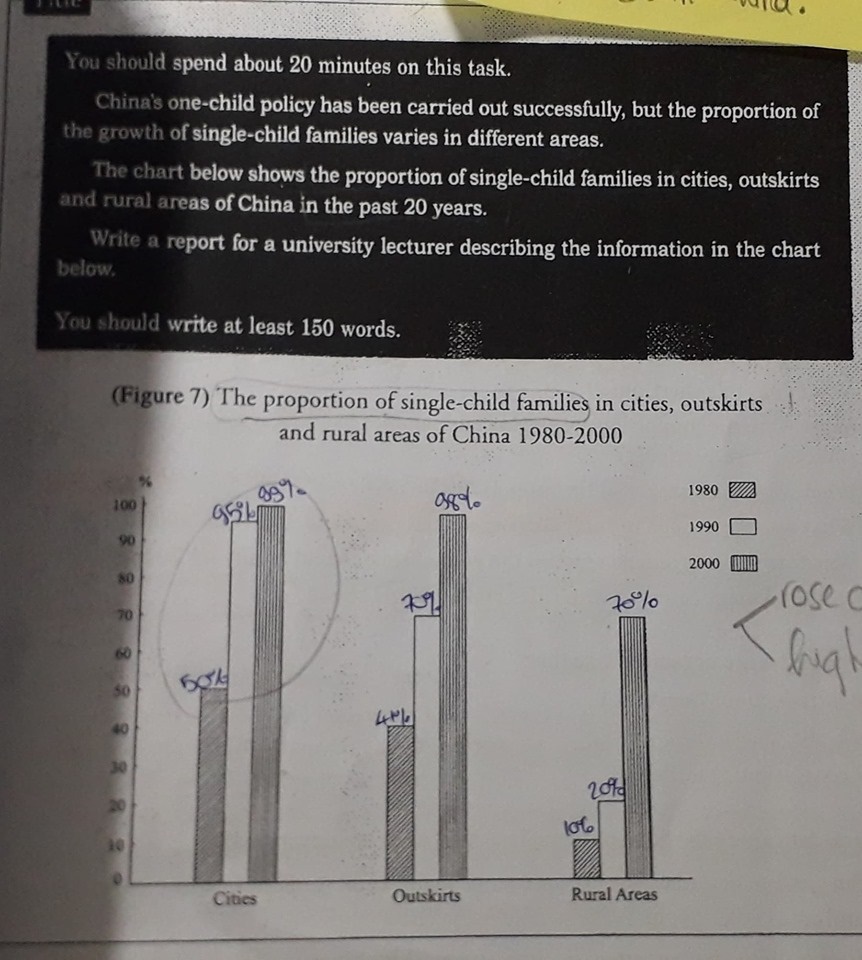
The bar chart illustrates the proportion of families having only-child in cities, outskirts and rural areas of China between 1980 and 2000. Units are measured in percent.
Overall, it is clear that the number of only-born families increased over 20 years. In cities, there was a higher proportion of parents not having a second child, being higher than that in two other areas.
Cities' single-child family rate was exactly 50% in 1980, being higher than rates of outskirts and rural areas ( about 41% and 10% respectively). After ten years, it rose to around 95%, while the figure reached approximately 70% in outskirts and increased nearly twice as high as its rate in 1980 in rural areas. Over the first period of ten years, the proportion of parents whose child was not having siblings went up roughly double.
In the last ten-year period, those areas continued to experience an increase. There was a slight rise in the figure of cities, by approximately 4%, but it almost hit the maximum point ( just below 100% by about 1%). In the same way as in cities, in outskirts, the proportion rocketed quickly from 70% to 98%, having greatly narrowed the gaps between cities and the outskirts. However, the area experiencing the highest dramatic climb was rural areas, by around a half. Therefore, the rate of families with a child has been predicted to continue to increase after 2000, possibly reaching 100%.
Top answer
walk ladder 314 The bar chart illustrates the proportion Didn't you read my last feedback? 4. "illustrate" is not a good verb for graphs and charts.
- walk ladder 314 The bar chart illustrates the proportion Didn't you read my last feedback?
- 4.
- "illustrate" is not a good verb for graphs and charts.
- Use "illustrate" for diagrams.
- Do not use it for graphs, plots and charts.
Get the Weekly English Kit 📬
New words, one handy idiom, and a 2-minute quiz — delivered to your inbox to keep your streak alive.
walk ladder 314The bar chart illustrates the proportion
Didn't you read my last feedback?
4. "illustrate" is not a good verb for graphs and charts. Use "illustrate" for diagrams. Do not use it for graphs, plots and charts.
walk ladder 314between 1980 and 2000.
I
 Related Questions