
Please help me check my writing task 1. Thank you a lot
You should spend about 20 minutes on this task.
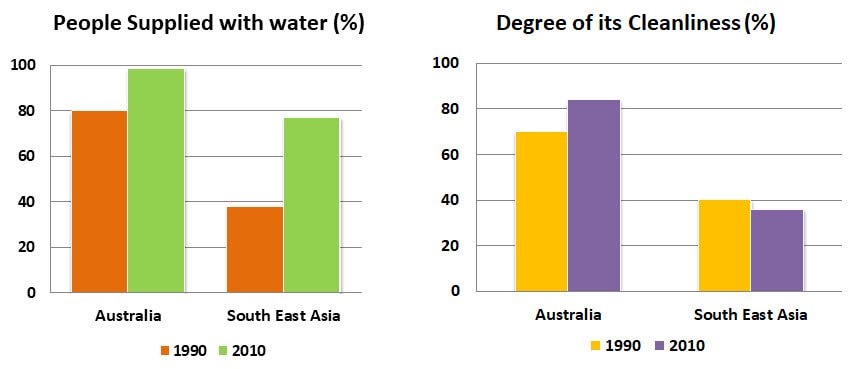
The charts show the amount and quality of water supplied to two regions of the world.
Summarise the information by selecting and reporting the main features, and make comparisons where relevant
You should write at least 150 words.
The two bar charts compare Australia versus South East Asia in terms of the proportion of inhabitants receiving water and the level of cleanliness of water supply in two years 1990, 2010.
In general, a higher percentage of citizens in both regions received water supply in 2010 compared to 1990. However, in both years Australian population was supplied with cleaner water than those in South East Asia.
In detail, fourth-fifths of citizens in Australia had a water supply, which was twofold as much as South East Asia's population in 1990. After 20 years, the gap between them narrowed significantly, as nearly all people in Australia were supplied water while the percentage of South East Asia's reached the point where the former stood at in 1990. Regarding the quality of water, the water supply in Australia in 2010 had a purity level of 80% compared to above 60% in 1990. In contrast, the cleanliness level in South East Asia did not change much in two years, ranging 39% to 40%
Thank you, teacher!
Top answer
This practice exam is defective. In the second chart, "Degree of cleanliness" has no meaning - it is nonsense. The quality of water is determined by taking samples of water and testing them for acidity, color, dissolved oxygen, bacterial content, and turbidity (a measure of the suspended particles in the water).
- This practice exam is defective.
- In the second chart, "Degree of cleanliness" has no meaning - it is nonsense.
- The quality of water is determined by taking samples of water and testing them for acidity, color, dissolved oxygen, bacterial content, and turbidity (a measure of the suspended particles in the water).
- The measure of water quality is not percent.
- The only way I can interpret this chart is to assume it measures the percentage of the water supplied that meets the regional quality standards.
Get the Weekly English Kit 📬
New words, one handy idiom, and a 2-minute quiz — delivered to your inbox to keep your streak alive.
This practice exam is defective. In the second chart, "Degree of cleanliness" has no meaning - it is nonsense.
The quality of water is determined by taking samples of water and testing them for acidity, color, dissolved oxygen, bacterial content, and turbidity (a measure of the suspended particles in the water). The measure of water quality is not percent.
The only way I can interp
 Related Questions