
Please help me check my writing.
Hi please take a look at my writing and feel free to make comments on my work. Thanks in advance!
Topic: The graph below shows in percentage terms the changing patterns of domestic access to modern technology in homes in the UK.
Summarize the information by selecting and reporting the main features, and make comparisons where relevant.
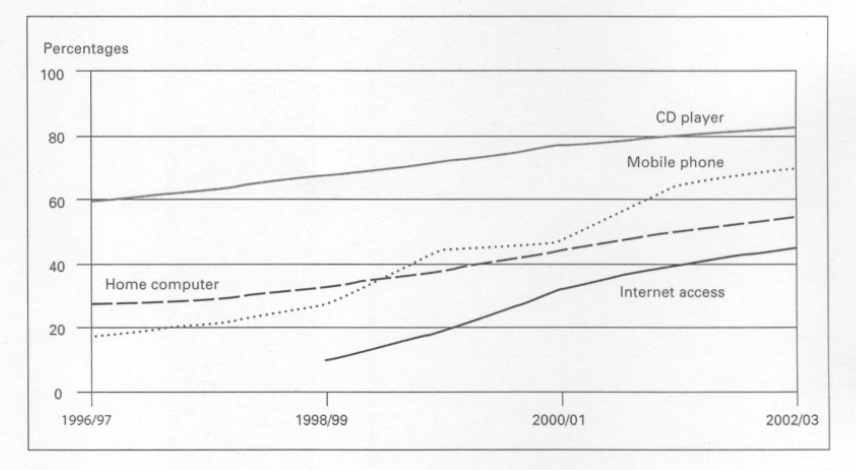
The line graph provides information about how domestically accessing new technological inventions namely CD player, mobile phone, Internet and home computer changed in households in the UK over a 7 year period from 1996.
It can be seen from the chart that there was an upward trend in the figures for users of these technologies with the proportion of homes using CD players the highest. Since Internet appeared later than the others, the proportion of homes accessing to Internet was the lowest of all.
In 1996/97, the percentages of CD player, home computer and Mobiphone users were just under 60, around 30 and less than 20 respectively. Over next seven years, the former rose gradually and considerably by approximately a fifth to over 80. Likewise, there was nearly a threefold increase in the percentage of mobile phone users, making it overtake that of home computer users.
It was not until 1998/99 that Internet appeared with the figure for Internet users around 10 percent. Although Internet usage growth rate is highest of four with an increase of more than threefold in 2002/03, the percentage of internet users was still lower than that of other users.
Top answer
Please read my advice on Task 1 essays: IELTS TASK 1: Hints, Tips And Advice The line graph provides information about (That is too vague. ) how domestically accessing new technological invention s (unnatural) namely CD player, mobile phone, Internet and home computer changed in households in the UK over a 7 year period from 1996. ) Model paragraph: The line graph plots the percentage of households in the UK that had one or more of four different technologies in their homes, namely namely a CD player, a mobile phone, Internet service and a home computer between the years 1996 and 2003.
- Please read my advice on Task 1 essays: IELTS TASK 1: Hints, Tips And Advice The line graph provides information about (That is too vague.
- ) how domestically accessing new technological invention s (unnatural) namely CD player, mobile phone, Internet and home computer changed in households in the UK over a 7 year period from 1996.
- ) Model paragraph: The line graph plots the percentage of households in the UK that had one or more of four different technologies in their homes, namely namely a CD player, a mobile phone, Internet service and a home computer between the years 1996 and 2003.
- ) there was an upward trend in the figures (wrong word) for users of these technologies with the proportion of homes using CD players being the highest.
- Since the Internet appeared later than the others, the proportion of homes accessing to Internet was the lowest of all.
Get the Weekly English Kit 📬
New words, one handy idiom, and a 2-minute quiz — delivered to your inbox to keep your streak alive.
Please read my advice on Task 1 essays: IELTS TASK 1: Hints, Tips And Advice
The line graph provides information about (That is too vague. Be precise and tell the reader exactly what is on the graph.)
 Related Questions