
Please help me check my Task 1 essay.
The chart below shows waste collection by a recycling centre from 2011 to 2015.
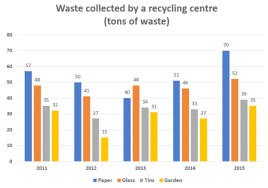
The bar chart compares the amount of four different kinds of waste collected by a recycling centre in 4 years times, from 2011 to 2015.
Overall, there were increases in the proportion of four kinds of waste. While garden waste always had the lowest proportion, the figure for the paper was usually the highest.
Starting at 57 tons in 2011, the proportion of paper waste had a dig to 40 tons in 2013 before climbing to 70 tons in 2015, holding the largest amount out of the four categories. Similarly, the amount of garden rubbish slightly rose from 32 tons in 2013 to 35 tons in 2015 despite having two declines in 2012 and 2014, with 15 tons and 27 tons respectively, remaining the smallest figure during the examined period.
There was also a climb in the proportion of glass and tins waste although these changes were not considerable, with the amount of glass waste increasing from 48 tons in 2011 to 52 tons in 2015 and the figure for tins growing to 39 tons in 2015 while 35 tons in 2011.
Top answer
That picture of the chart is too small. Can you post a larger version please? - Click Reply.
- That picture of the chart is too small.
- Can you post a larger version please?
- - Click Reply.
- -Click Attach images.
- -Click "Choose Files" -Click "Add to Post"
Get the Weekly English Kit 📬
New words, one handy idiom, and a 2-minute quiz — delivered to your inbox to keep your streak alive.
That picture of the chart is too small. Can you post a larger version please?
- Click Reply.
-Click Attach images.
-Click "Choose Files"
-Click "Add to Post"
 Related Questions