
Please help me check my task 1
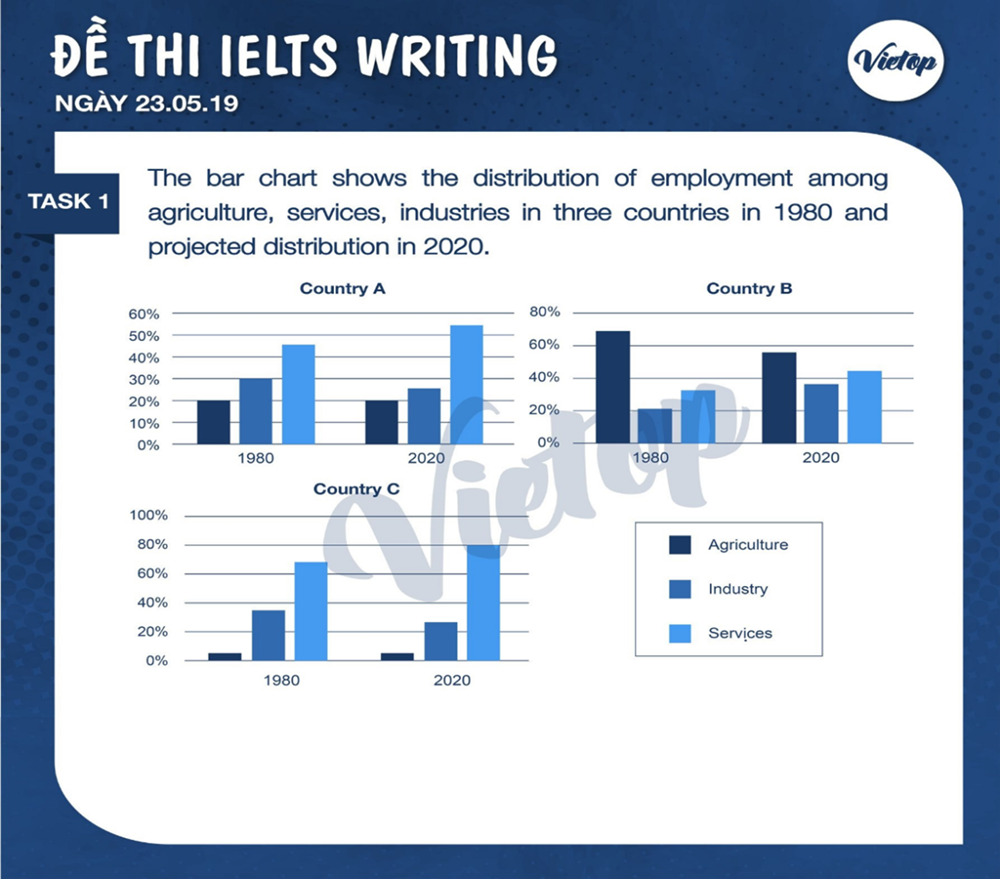
The three bar charts compare three countries, labeled A, B, C in terms of the proportion of employees in three different sectors including agriculture, industry and services. Data are shown for one year in the past, 1980 as well as a projection in 2020.
In general, it was the services that attracted the majority of employees of country A and C while agriculture was the main sources of employments for people in country B. There are no predicted changes in the employment distribution across three nations.
The proportions of employment in country A and C were similar. In 1980, nearly half or more were employed in services, followed by industry, at 30% and 35% respectively and the smallest in agriculture. After two decades, a slight increase is expected to the percentage of service workers, with 53% for the former and 80% for the latter. In contrast, the two other sectors are predicted to remain unchanged or dropped marginally by 2020.
Regarding country B, the largest percentage accounted for agricultural employees, at 62%, whereas that of industry and services ranged between 20% and 30%. It is predicted that trends will also remain the same in country B, despite an approximate 15% decrease in agriculture jobs.
Top answer
The three bar charts compare three countries , labeled Country A, Country B, and Country C, compare them in terms of the proportion of their population employed employees in three different economic sectors: including agriculture, industry and services. Data are shown for one year in the past, 1980 as well as a projection for 2020. In general, it was the services that had attracted the majority of employees of C ountry A and C while agriculture was the main sources source of employment employments for people in country B.
- The three bar charts compare three countries , labeled Country A, Country B, and Country C, compare them in terms of the proportion of their population employed employees in three different economic sectors: including agriculture, industry and services.
- Data are shown for one year in the past, 1980 as well as a projection for 2020.
- In general, it was the services that had attracted the majority of employees of C ountry A and C while agriculture was the main sources source of employment employments for people in country B.
- There are no predicted changes in the rank order of the sectors in employment distribution across the three nations.
- The proportions of employment in country A and C were similar.
Get the Weekly English Kit 📬
New words, one handy idiom, and a 2-minute quiz — delivered to your inbox to keep your streak alive.
The three bar charts compare three countries, labeled Country A, Country B, and Country C, compare them in terms of the proportion of their population employed empl
 Related Questions