
Please help me check my IELTS writing task 1- Pie chart.
Dear teacher,
Please help me check my IELTS writing task 1- Pie chart.
Thank you,
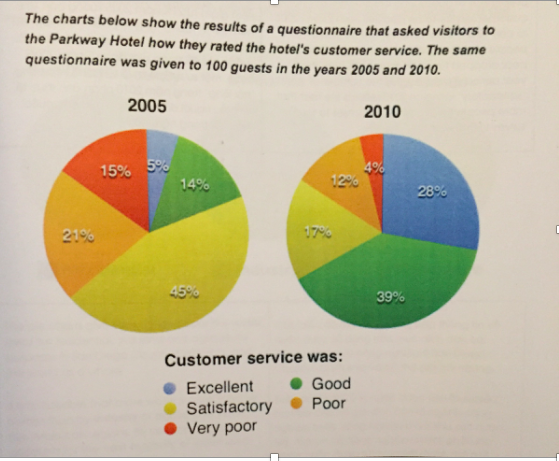
The pie charts illustrate the result of a survey was rated by 100 customers at the Parkway Hotel between 2005 and 2010.
Overall, it is clear that the customer reviews about hotel service showed that their satisfaction increased significantly from 2005 to 2010. In 2010, the Parkway Hotel service has received the satisfaction of the majority of visitors, while in 2005, the reviews of visitors for the hotel service at just high at satisfactory and poor.
In the year 2005, the proportion of visitors who voted the customer service as excellent only 5%, while the percentage of visitors rated for the service as excellent increased to 28% in 2010. Moreover, only 14% of the customer rated for the service in Parkway Hotel as good in 2005. After 5 years, the evaluation of the customers as good rose significantly to 39%.
By the year 2005, there are many negative feedbacks about the customer service. Specifically, the review for poor service accounted for 21%, but in next 5 year, the proportion of the guests rated as poor service dropped by 12%. Furthermore, the people who voted for very poor service at 15% in 2005 then declined to 4% over the period 5 years. In 2010, visitors who rated for satisfactory of hotel service only at 17%, while this survey about satisfactory of Parkway Hotel accounted for 45% in 2005.
Top answer
Your essay is mostly incorrect descriptions and phrases. Task 1 is challenging. You must be very precise and mathematical in your writing.
- Your essay is mostly incorrect descriptions and phrases.
- Task 1 is challenging.
- You must be very precise and mathematical in your writing.
- The pie charts illustrate (wrong word) the result of a survey was rated (ungrammatical.
- Did they rate the survey?
Get the Weekly English Kit 📬
New words, one handy idiom, and a 2-minute quiz — delivered to your inbox to keep your streak alive.
Your essay is mostly incorrect descriptions and phrases. Task 1 is challenging. You must be very precise and mathematical in your writing.
The pie charts illustrate (wrong word) the result of a survey was rated (ungrammatical. Did they rate the survey? - e.g. a good survey or a
 Related Questions