
Please help me check my Ielts task1 essay. Thanks for your help. In this essay, I divide 2 detaied paragraph according to the trends.
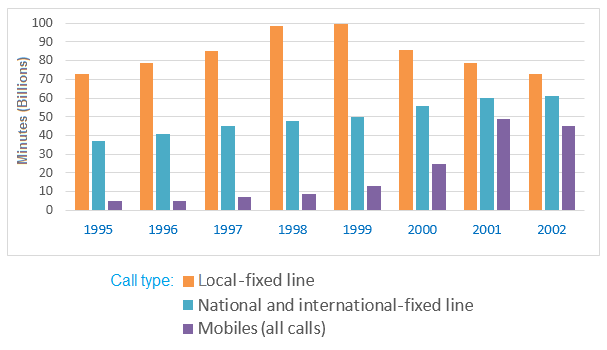
Requirement: The chart below shows the total number of minutes (in billions) of telephone calls in the UK, divided into three categories, from 1995-2002.
- My essay:
The provided bar chart compares how many minutes British people spent on three types of phone during the period from 1995 to 2002.
It is clear that local landline services were responsible for total highest minutes over the period of 7 years. The overall minutes of cellphones and national and international landlines experienced an upward tendency throughout the whole year.
In 1995, local-fixed lines gained a huge popurlarity at just above 70 billion minutes, which was much higher than that of mobiles (5 billion minutes) and national and international-fixed lines (38 billion minutes). The following four years, the usage of 3 types of telephone calls saw an increase. While residental services reached the vertex of 90 billion minutes in 1999, the total number of minutes spending on cell phones and national and international landlines was respectively at around 12 billion minutes and 50 billion minutes.
From 1999 onwards, the quatity of mobile and national and international call making continued to rise gradually. In 2001, the total minutes of call made by cell phones accounted for well over 40 billion minutes, which was highest in this category throughout the period. In 2002, national and international-fixed line showed a same trend, hitting the peak of almost 61 billion minutes. In contrast, the usage of local landlines experienced a moderate decline, finishing at the same level that it began (72 billion minutes).
Top answer
htm
- htm
Get the Weekly English Kit 📬
New words, one handy idiom, and a 2-minute quiz — delivered to your inbox to keep your streak alive.
 Related Questions