
Please help me check my Ielts task1 essay. Thanks for your help.
Requirement: The following chart shows the results of a British survey taken in 2009 related to Housing preferences of UK people.
My essay:
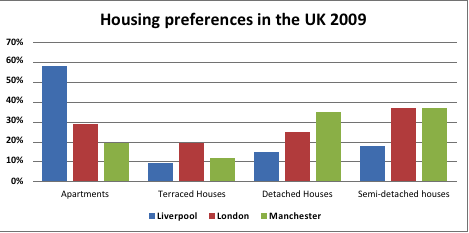
The given bar chart compares the percentage of British preferences in four different types of housing which was recorded from a poll in 2009.
The British had less preferences for terraced houses than others, which was opposed to appartment. People living in Liverpool showed a conderabe interest in living in apartments.
Apartments was the most popular type of housing to respondents in Liverpool, with just under 60%, which is the highest figure shown on the chart. While people in Liverpool prefered to live in apartments, people in Manchester would rather to live in semi-detached houses.
Housing preferences of respondents in London was not significant, just under 40% for all types. Citizens in London showed a bigger love for semi-detched houses, accounted for around 38%. The opposite was true for terraced houses with only 19%. The percentage of preferences for apartments and detached houses was respectively 39% and 25%.
Top answer
You wrote exactly 150 words, which to very close to the minimum. You should write a little more than the minimum to give yourself some leeway. The given bar chart compares the percentage of British preferences in for four different types of housing which was as recorded from a survey poll in 2009.
- You wrote exactly 150 words, which to very close to the minimum.
- You should write a little more than the minimum to give yourself some leeway.
- The given bar chart compares the percentage of British preferences in for four different types of housing which was as recorded from a survey poll in 2009.
- (Incomplete.
- ) Here is an example paragraph that describe all the aspects of this bar chart: The bar chart compares the preferences of residents of three different cities in the UK for different types of accommodation.
Get the Weekly English Kit 📬
New words, one handy idiom, and a 2-minute quiz — delivered to your inbox to keep your streak alive.
You wrote exactly 150 words, which to very close to the minimum. You should write a little more than the minimum to give yourself some leeway.
The given bar chart compares the percentage of British preferences in for four different types of housing which was as
 Related Questions