
Please help me check my Ielts task1 essay. Thanks for your help.
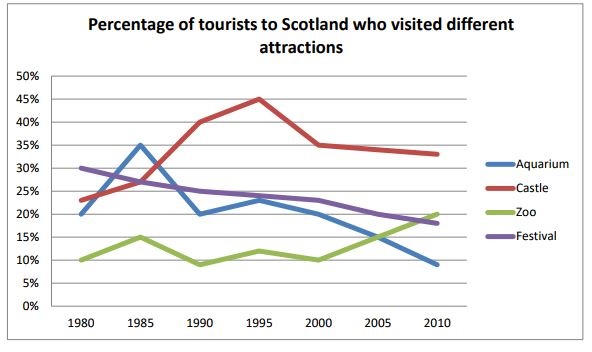
The line graph below shows the percentage of tourists to Scotland who visited four different attractions from 1980 to 2010.
* My essay:
As is observed, Castle and Zoo experienced an upward tendency while a number of tourists visiting Aquarium and Festival declined over a 20-year period. Overall, it seemed that Castle was the most popular attraction for almost timescale.
In 1980, the percantage of tourists paying a visit to Castle was well abouve 20% which was more than 10% higher than that of Zoo (10%). The following 15 years, a number of visitors who chose to visit Castle increased gradually to reach the vertex of 45% in 1995, followed by a substantial drop of about 11% . Within 20 years from 1980 to 2000, Zoo saw a moderate oscillation before hitting the peak of 20% at the end of the period.
In contrast, there was a reduction in the proportion of visitors to Festival and Aquarium. In 1980, Festival was the most favourite attraction with 30% of visit, compared to 20% of Aquarium. Despite the highest point of 35% in 1985, a number of tourists declined to just under 10% in 2010. Festival witnessed a sustained decrease throughout the whole period, finishing with the figure of 20%.
Top answer
[ 1] The graph compares four different attractions in Scotland in terms of the percentage of tourists who visited them over three decades starting in 1980. As is observed, Overall, the percentage of visitors to the Ca stle and Zoo experienced an upward tendency while a number of tourists visiting a quarium and the f estival declined over a 20 that 30 -year period , whereas the graphs for the zoo and the castle fluctuated but rose on the whole . Overall, it seemed that Moreover, the c astle was the most popular attraction for almost [ 2] most of that period.
- [ 1] The graph compares four different attractions in Scotland in terms of the percentage of tourists who visited them over three decades starting in 1980.
- As is observed, Overall, the percentage of visitors to the Ca stle and Zoo experienced an upward tendency while a number of tourists visiting a quarium and the f estival declined over a 20 that 30 -year period , whereas the graphs for the zoo and the castle fluctuated but rose on the whole .
- Overall, it seemed that Moreover, the c astle was the most popular attraction for almost [ 2] most of that period.
- timescale.
- In 1980, the perc e ntage of tourists paying who paid a visit to the c astle was well ab o ve 20 %, which was more than 10% higher than double that of the z oo (10%).
Get the Weekly English Kit 📬
New words, one handy idiom, and a 2-minute quiz — delivered to your inbox to keep your streak alive.
[ 1] The graph compares four different attractions in Scotland in terms of the percentage of tourists who visited them over three decades starting in 1980.
As is observed, Overall, the percentage of visitors to the Castle an
 Related Questions