
Please help me check my essay for IELTS Task 1
Can you please check the essay for me ? Thank you in advance.

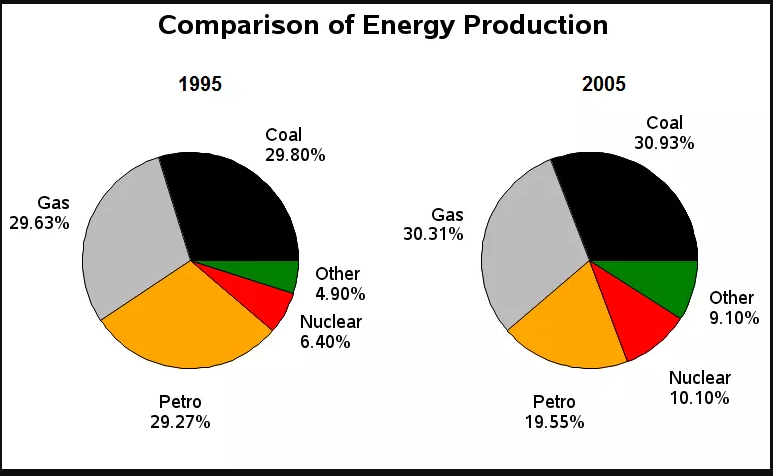
The pie charts compare the proportion of different sources of energy in France in 1995 and 2005.
Overall, gas and coal were the most popular sources of energy production, while nuclear and other sources represent the least proportion in both years. Additionally, all types of energy sources increased slightly over the 10 year period, except for petrol which decreased instead.
In detail, energy generated by gas accounted for 29.63% in the first year and rose minimally to 30.31% in 2005. Similarly, the proportion of energy produced by coal rose slightly from 29.80% in 1995 to 30.93% after ten years.
In terms of the remaining sources of energy, there was a roughly 5% growth in production from both nuclear and other sources to 10.10% and 9.10%, respectively. Also, energy produced by petrol was 29.27% in 1995, which showed a moderate decline of about 10% to 19.55% in 2005.
Top answer
) in France in 1995 and 2005. Overall, gas and coal were the most commonly used popular sources of energy production, while nuclear and other sources represent (wrong form) the least proportion in both years. Additionally, (missing words) all types of energy sources increased slightly over the 10 year period, except for petrol which decreased instead .
- ) in France in 1995 and 2005.
- Overall, gas and coal were the most commonly used popular sources of energy production, while nuclear and other sources represent (wrong form) the least proportion in both years.
- Additionally, (missing words) all types of energy sources increased slightly over the 10 year period, except for petrol which decreased instead .
- 31% in 2005.
- 93% after ten years.
Get the Weekly English Kit 📬
New words, one handy idiom, and a 2-minute quiz — delivered to your inbox to keep your streak alive.
The pie charts compare the proportion of different sources of energy (What are they?) in France in 1995 and 2005.
Overall, gas and coal were the most commonly used popular sources of energy production, while nuclear and other sources represent (wrong form) the least pro
 Related Questions