
Please Help Me By Evaluating My Essay. [IELTS Writing Task 1]
The table gives information about five types of vehicles registered in Australia in 2010, 2012 and 2014.
The given table provides details on the registration of five different types of vehicles an Australia in three respective years - 2010, 2012 and 2014.
Overall, passenger vehicle was the most prevalent mode of transportation in all three mentioned years. Over a period of four years, all types of vehicles experienced upward trends where motorcycles was seen to undergo the most significant one.
In 2010, majority of transports registered in Australia were found to be passenger vehicles (11,800,000). It was considerably higher than the rest of the surveyed vehicle types: Commercial vehicles (2,300,000), Motorcycles (540,000), Heavy trucks (384,000) and Light trucks (106,000). After four years, although the number of each of the mentioned means of transport rose, Motorcycles witnessed the most dramatic increase whose percentage was shown to be 30.8% in 2014. There was an approximately equal difference of around 6% - 7% in the rise of the next three types of vehicles - Light truck (23.5%), Commercial vehicles (17.4%) and Passenger Vehicles (10.2%). The percentage of Heavy trucks (8.3%) was witnessed to be slightly lower than that of the Passenger vehicle (10.2%) in four years time.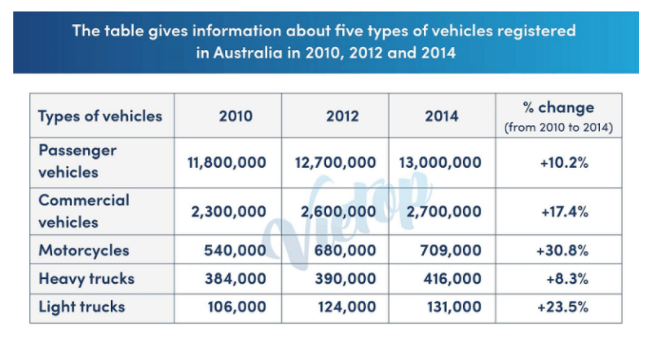
Top answer
The given (Do not use "given," provided", "above," or "below") table provides details on numbers of the registration s for of five different types of vehicles an Australia in three respective years - 2010, 2012 and 2014. It also lists the percent change from 2010 to 2014. Overall, the passenger vehicle was had the largest count of registrations the most prevalent mode of transportation in all three mentioned years.
- The given (Do not use "given," provided", "above," or "below") table provides details on numbers of the registration s for of five different types of vehicles an Australia in three respective years - 2010, 2012 and 2014.
- It also lists the percent change from 2010 to 2014.
- Overall, the passenger vehicle was had the largest count of registrations the most prevalent mode of transportation in all three mentioned years.
- Over a this period of four years, numbers of all types of vehicles experienced (Wrong word.
- Vehicles do not witness things.
Get the Weekly English Kit 📬
New words, one handy idiom, and a 2-minute quiz — delivered to your inbox to keep your streak alive.
The given (Do not use "given," provided", "above," or "below") table provides details on numbers of the registrations for of five different types of vehicles an Australia in three respective years - 2010, 2012
 Related Questions