
Please help me by correcting my essay, many thanks!me by correcting my essay, many thanks!
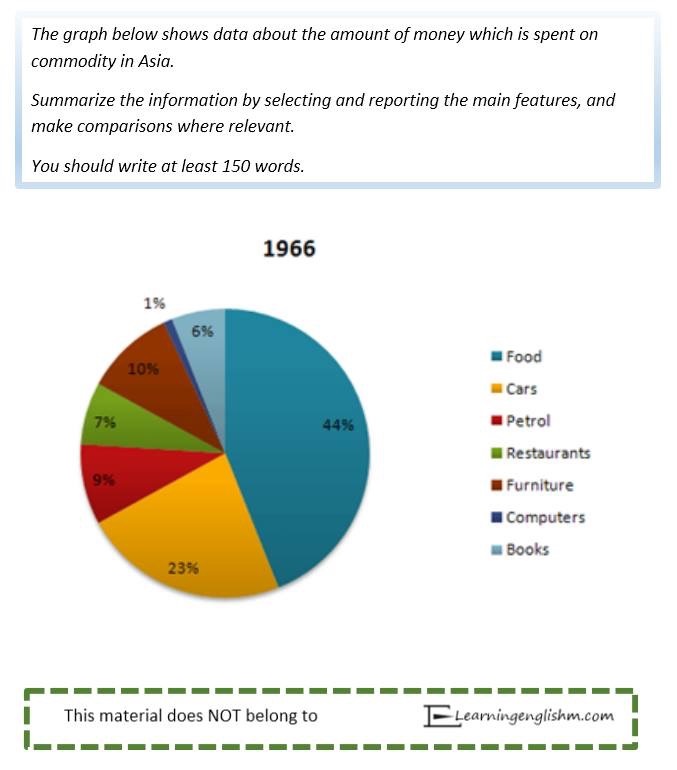
The pie chart indicates information about the spending money in Asia in the year 1966. There are seven commodities that were showed in this pie chart. They are food, cars, petrol, restaurants, furniture, computers and books.
Overall, the allocation of Asian spending was not balanced. On the one hand, they took most money to buy food. On the other hand, they spent a little money on purchasing computers.
Exactly 44%, food is the largest commodity of Asian, nearly half a part of Asian commodity. The second biggest commodity was cars, 23%, approximately half a part percentage of food. Less than 13% compared to the percentage of cars, furniture accounted for 10% in Asian spending.
Petrol was the fourth largest commodity in Asian spending, it made up 9%. Restaurants and books had the nearly same amount, 7% and 6%, respectively. Only 1%, computer was the commodity had the least spending in Asia.
Top answer
I do not know where you found this Task 1 exercise, but the instructions are very poor English. You will not learn good English from this site! Please use a proper IELTS site to get your exercises.
- I do not know where you found this Task 1 exercise, but the instructions are very poor English.
- You will not learn good English from this site!
- Please use a proper IELTS site to get your exercises.
- ) below shows data about the amount (Wrong.
- 00) of money which is spent on commodity (wrong form, wrong word.
Get the Weekly English Kit 📬
New words, one handy idiom, and a 2-minute quiz — delivered to your inbox to keep your streak alive.
I do not know where you found this Task 1 exercise, but the instructions are very poor English. You will not learn good English from this site!
Please use a proper IELTS site to get your exercises.
https://ieltsliz.com/ielts-sample-chart-for-writing-task-1/
The
The pie chart indicates information about the spending money (Very poor English. "indicate" is not good. "information" is not good. "spending money" is not good.) in Asia in the year 1966. There are seven commodities (These things are not commodities. Wrong word) that were
 Related Questions