
Please help me!!!
The pie charts below show electricity generation by source in New Zealand and Germany in 1980 and 2010.
Summarise the information by selecting and reporting the main features, and make comparisons where relevant.
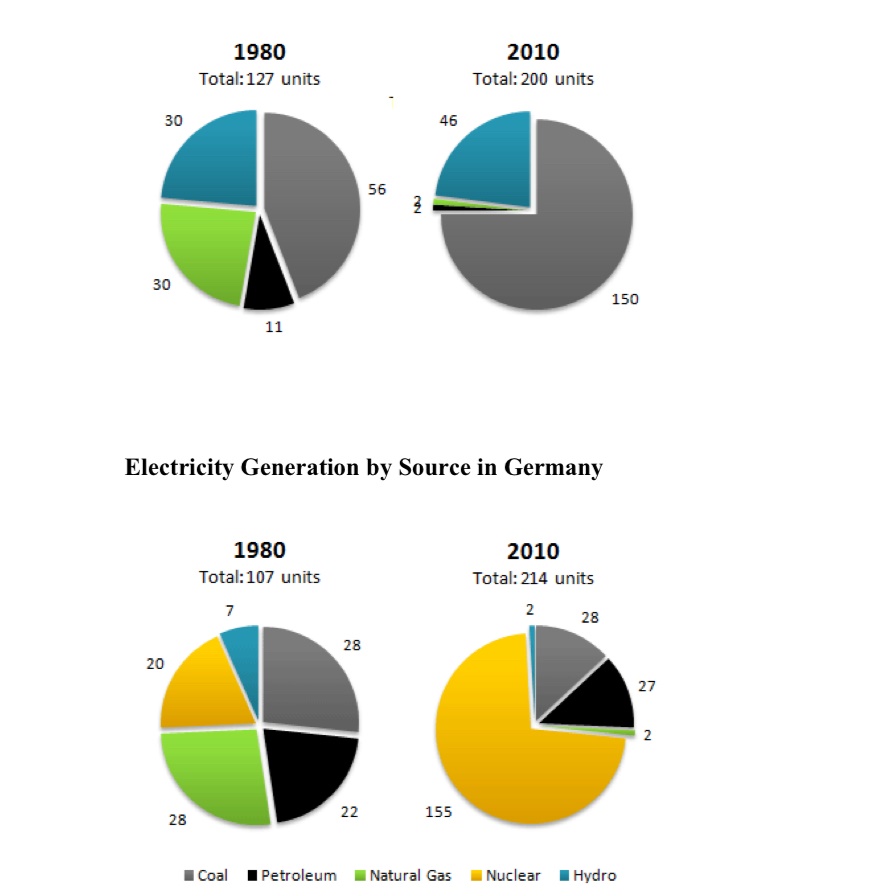
The four pie charts, two label 1980 and the others 2010, compare electricity generation by various source in New Zealand and Germany. There are four categories of source in New Zealand: coal, petroleum, natural gas, hydro. There is a fifth category of source in Germany: nuclear. In additon, above each chart is the information about total of electricity generation each year.
Overall, both nations produced more electricity over thirty years. In 1980, New Zealand had higher level of electricity production, but it was surpassed by Germany thirty years later. In 2010, coal was by far the most electricity generation in New Zealand, whereas nuclear produced most electricity in the remaining country.
In detail, the ratio between hydro and natural gas in New Zealand was 1:1 in 1980, but it rapidly increased to 23:1 in 2010. In that year, the values for natural gas and petroleum were negligible, with only 2 units each source. In Germany, hydro was consistently the lowest electricity generation from 1980 to 2010, with 2 units. In 1980, coal produced equal to natural gas. In 2010, coal had no change in production, still at 28 units, but was 14 times more than natural gas. Comparing to Germany, the value for petroleum in New Zealand was double, 56 units versus 28 units, but coal was only half, with 11 units in 1980. In 2010, there were 150 units for coal and 155 units for nuclear, which were the highest levels of electricity generation in New Zealand and Germany respectively.
Top answer
The four pie charts, two for New Zealand and two for Germany, label ed 1980 and the others 2010, compare electricity generation by various source (wrong form) in 1980 and 2010. New Zealand and Germany. There are four five sources categories of source in New Zealand: coal, petroleum, natural gas, hydro and nuclear.
- The four pie charts, two for New Zealand and two for Germany, label ed 1980 and the others 2010, compare electricity generation by various source (wrong form) in 1980 and 2010.
- New Zealand and Germany.
- There are four five sources categories of source in New Zealand: coal, petroleum, natural gas, hydro and nuclear.
- There is a fifth category of source in Germany: nuclear.
- In additon , above each chart is the information about total amount of electricity generat ed.
Get the Weekly English Kit 📬
New words, one handy idiom, and a 2-minute quiz — delivered to your inbox to keep your streak alive.
The four pie charts, two for New Zealand and two for Germany, labeled 1980 and the others 2010, compare electricity generation by various source (wrong form) in 1980 and 2010. New Zealand and Germ
 Related Questions