
Please help IELTS writing task 1
The graph below shows the contribution of three sectors – agriculture, manufacturing, and business and financial services – to the UK economy in the twentieth century. Summarize the information by selecting and reporting the main features, and make comparisons where relevant.
My essay:
The graph illustrates the contribution of three sectors, including agriculture, manufacturing and business and financial services to the UK economy in four different years during the twentieth century.
In 1900 most of the British economy relied on agriculture and manufacturing, whereas financial sector formed only a small fraction of the economy of the UK. The contribution of agriculture steadily increased over the first years of the century, rising from 49% in 1900 to around 52% in 1950, compared to manufacturing sector which experienced a slight decrease from about 45% to 40% approximately. During the same period, business and financial activities began to rise gradually from 3% to almost 10% in 1950.
Agricultural sector declined dramatically over the next 25 years, since it formed only 15% in 1975 of the economy. The portion of manufacturing decreased to nearly 35%. In contrast with the other two sectors, business and finance rocketed to around 20%.
Finally in 2000, the agriculture and manufacturing downward trend continued in a way that made 3% and 20% of the British economy respectively; however, the contribution of business and financial sector incremented to almost 45% of the UK economy.
In summary, it is noticeable that while agriculture rose until the middle of the century when it started to drop, manufacturing and financial sectors had opposite trends: the former encountered significant reduction and the latter became more and more important during this period of time.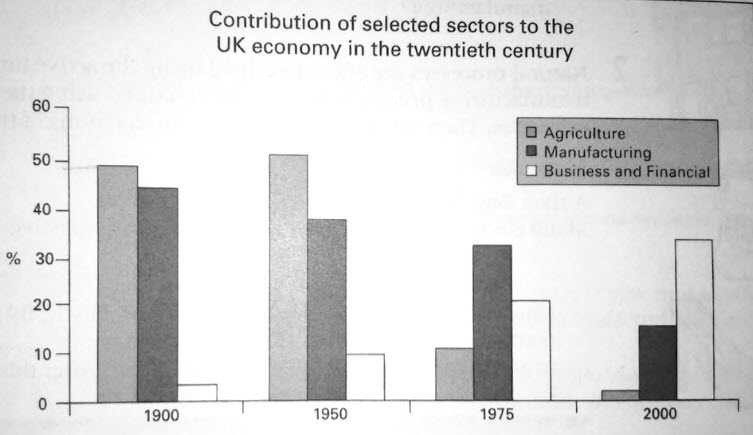
Top answer
The bar chart illustrates the percentage of agriculture, manufacturing and business and financial service which contributed to the UK economy during 1900 to 2000. In general, agriculture and manufacturing experienced a global downward trend in the contribution to the UK economy varying degree. In details, there was a slight rise of 3 percent to 53 percent in 1950 in the former, followed by a sharp increase to hit a trough of 2 percent in 2000.
- The bar chart illustrates the percentage of agriculture, manufacturing and business and financial service which contributed to the UK economy during 1900 to 2000.
- In general, agriculture and manufacturing experienced a global downward trend in the contribution to the UK economy varying degree.
- In details, there was a slight rise of 3 percent to 53 percent in 1950 in the former, followed by a sharp increase to hit a trough of 2 percent in 2000.
- As regards manufacturing, the period from 1900 to 2000 saw a steady fall of 30 percent in the contribution to the UK economy.
- In contrast, an opposite tendency was true of the rest over the same period of time.
Get the Weekly English Kit 📬
New words, one handy idiom, and a 2-minute quiz — delivered to your inbox to keep your streak alive.
The bar chart illustrates the percentage of agriculture, manufacturing and business and financial service which contributed to the UK economy during 1900 to 2000.
In general, agriculture and manufacturing experienced a global downward trend in the contribution to the UK economy varying degree. In details, there was a slight rise of 3 percent to 53 percent in 1950 in the former, followed
 Related Questions