
Please help - IELTS Task 1 - land use by purpose
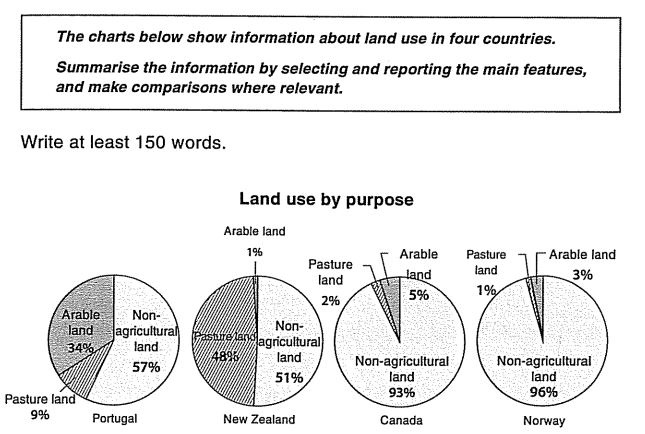
The charts compare the proportion of land used for different purposes in Portugal, New Zealand, Canada, and Norway.
Overall, it is unequivocally that most of the land used in those countries are non-agricutural, especially in Canada and Norway, where that type of land accounts for over 90% of their total used land. Also noticeable is that the percentages of arable and pasture land in Portugal and Newzealand are considerably higher than those in the other countries.
Looking closer at the chart for Portugal, pasture land has remarkably lower percentage than arable. However, in Newzealand, one can see quite a reversed situation, where there is only 1% of the country is dedicated to arable land, and 48% to pasture.
Moving on to the remaining countries, they share the same pattern of using their land. Non-agricultural land is dominant, with 93% and 96%, only less than 10% is accounted for by the other types.
Top answer
The charts compare the proportio n s of arable, non-agricultural, and pastural land used for different purposes in Portugal, New Zealand, Canada, and Norway. Overall, it is unequivocally that most of the land used in Norway and Canada is those countries are non-agricu l tural, while in New Zealand and Portugal that type accounts for about half the total land. especially in Canada and Norway, where that type of land accounts for over 90% of their total used land.
- The charts compare the proportio n s of arable, non-agricultural, and pastural land used for different purposes in Portugal, New Zealand, Canada, and Norway.
- Overall, it is unequivocally that most of the land used in Norway and Canada is those countries are non-agricu l tural, while in New Zealand and Portugal that type accounts for about half the total land.
- especially in Canada and Norway, where that type of land accounts for over 90% of their total used land.
- Also noticeable is that the percentages of arable and pasture land in Portugal and New Z ealand are considerably higher than those in the other countries.
- Arable land only represented a substantial percentage in Portugal.
Get the Weekly English Kit 📬
New words, one handy idiom, and a 2-minute quiz — delivered to your inbox to keep your streak alive.
The charts compare the proportions of arable, non-agricultural, and pastural land used for different purposes in Portugal, New Zealand, Canada, and Norway.
Overall, it is unequivocally that most of the land used
 Related Questions