
Please help - IELTS Task 1 - employment rate in sectors
Can you please help me with this Task 1 writing?
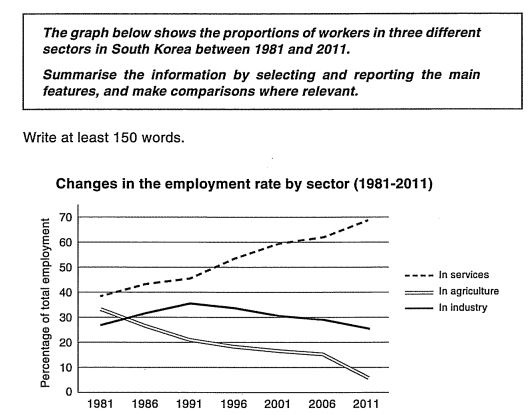
The chart reveals how the proportions of South Korean workers working in services, agriculture, and industry sectors changed over the period from 1981 to 2011.
Looking first as a whole, it is clear that there always were more people working in the services sector than in the other ones. Also noticeable is that the gap between this field and the other two widened remarkably during the surveyed period.
Looking now at the services sector in more detail, one can see that there was a clear upward trend. In 1981, less than 40 percent of South Korean workers were in this field. However, its percentage had significantly risen, before peaking at the highest proportion reached in 2011, nearly 70 percent.
Considering now the industry sector, although this was the least preferred working field in 1981, which less than 30 percent of workers chose, it had well surpassed the agriculture one by 1991, before gradually dropping back to almost that same rate in 2011.
As for the last surveyed sector, agriculture, there was a clear downward pattern over those years. It started at roughly 34 percent in 1981, then fewer and fewer people chose to work in it over the years, resulting in it being the least preferred sector from 1986 onwards, hitting the lowest point at approximately only 5 percent in 2011.
Top answer
The chart reveals how the proportions of South Korean workers working in the services, agriculture, and industry sectors changed over the period from 1981 to 2011. [ 1] Looking first as a whole, it is clear that there always were Overall, more people worke d ing in the services sector than in either of the other ones , and while the graph representing services increased, the other two declined. Also noticeable is that the gap between this field and the other two widened remarkably during the surveyed period.
- The chart reveals how the proportions of South Korean workers working in the services, agriculture, and industry sectors changed over the period from 1981 to 2011.
- [ 1] Looking first as a whole, it is clear that there always were Overall, more people worke d ing in the services sector than in either of the other ones , and while the graph representing services increased, the other two declined.
- Also noticeable is that the gap between this field and the other two widened remarkably during the surveyed period.
- [ 1] Looking now at the services sector in more detail, one can see that there was a clear upward trend.
- In 1981, [ 2] less fewer than 40 % percent of South Korean workers were employed in the services sector.
Get the Weekly English Kit 📬
New words, one handy idiom, and a 2-minute quiz — delivered to your inbox to keep your streak alive.
The chart reveals how the proportions of South Korean workers working in the services, agriculture, and industry sectors changed over the period from 1981 to 2011.
[ 1] Looking first as a whole, it is clear that there always were Overall, more people worke
 Related Questions