
Please help - IELTS Task 1 - Chile population
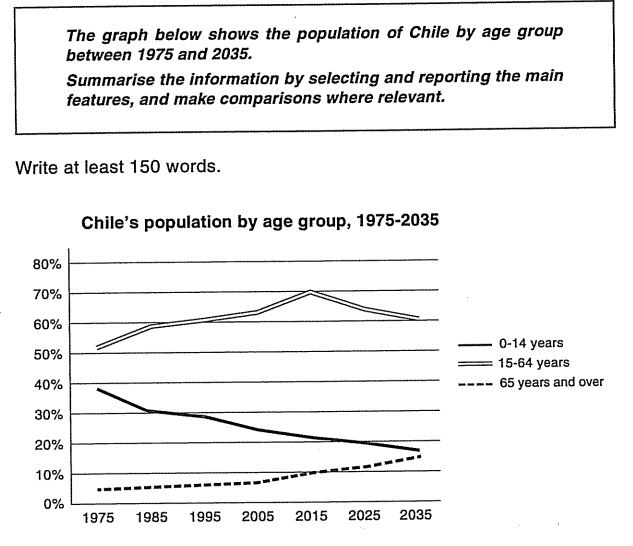
The chart reveals how much different age groups in Chile account for the country’s total population from 1975 to 2035.
Overall, more than half of the country’s citizens are from fifteen to sixty-four years old. Their proportion is much higher than that of the other two age groups. Also noticeable was that the gap between the youngest and the oldest groups has reduced significantly, and is predicted to nearly disappear in 2035.
Considering the first-mentioned group in more detail, its figure had soared substantially over the first four decades, peaking at seventy percent, which was the highest, in 2015. However, it is predicted that this group’s percentage will gradually drop during the next twenty years, finishing at sixty percent in 2035.
As for the other two groups, it is clear that they follow the opposite trends. The older group had an unpromising start, at around five percent, roughly one-eighth of the youngest one. Their figure slightly increased to ten percent in 2005. This upward pattern is likely to continue until the figure reached its peak at around fifteen percent in 2035. This percentage will also be reached by the last surveyed group, people who are fourteen years old or younger, but it will be a notable drop from its starting point of almost forty percent.
Top answer
The chart reveals how much compares three different age groups in Chile account for in terms of their proportion of the country’s total population from 1975 to 2035. Overall, more than half of the country’s citizens are from f ifteen to sixty-four years old. Their proportion is much higher than that those of the other two age groups.
- The chart reveals how much compares three different age groups in Chile account for in terms of their proportion of the country’s total population from 1975 to 2035.
- Overall, more than half of the country’s citizens are from f ifteen to sixty-four years old.
- Their proportion is much higher than that those of the other two age groups.
- Also noticeable was that the gap between the youngest and the oldest groups has reduced significantly, and is predicted to nearly disappear in 2035.
- ------------------------------------------- That’s okay so far, but you need to keep an eye on the word count.
Get the Weekly English Kit 📬
New words, one handy idiom, and a 2-minute quiz — delivered to your inbox to keep your streak alive.
The chart reveals how much compares three different age groups in Chile account for in terms of their proportion of the country’s total population from 1975 to 2035.
Overall, more than half of the country’s citizens are from f
 Related Questions