
Please give me some feedback on my IELTS Writing Task 1. Thanks!
The charts below show the percentage of monthly household income spent on various items by two different groups in one European country.
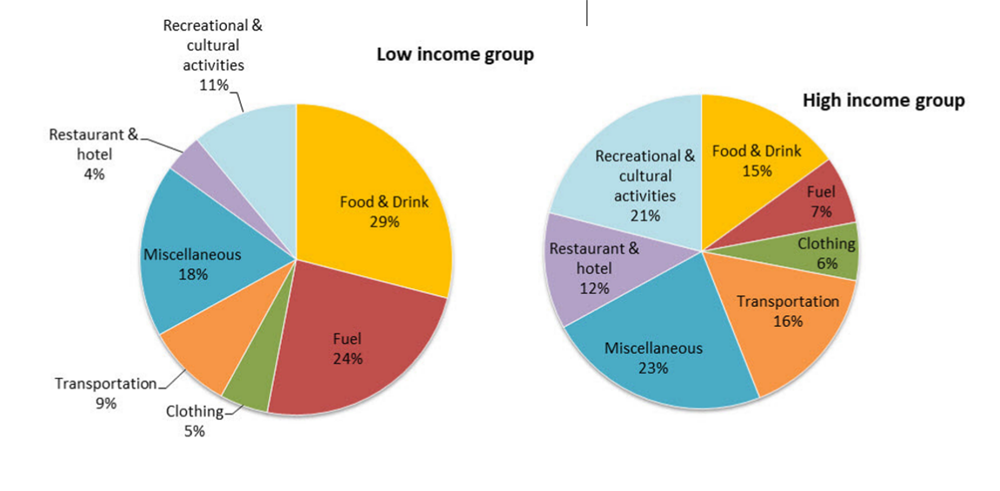
The two pie charts compare the monthly household expenditure of the rich and the poor in a European nation.
Overall, the high-income group spends mostly on food & drink and fuel while recreational & cultural activities and miscellaneous take most of the budget of the other group. In addition, clothing is of less concern to both groups.
With respect to the disadvantaged, food & drink is the category with the highest budget allocation (29%), followed by fuel (24%), both of which collectively constitute more than half of the total. Meanwhile, miscellaneous compose the third area of most expense, at 18%. The remaining 29% is divided over recreational & cultural activities, transportation, clothing, and restaurant & hotel, in that order, with recreational & cultural activities and transportation almost double the two others. By contrast, for people having a lucrative income, the share devoted to miscellaneous and recreational & cultural activities is largest, accounting for 23% and 21% separately. The three next major segments are transportation, food & drink, and restaurant & hotel, ranging from 16% to 12%. Fuel and clothing are almost evenly contributed the remaining 13% and become the least important categories.
Top answer
The expenses add up to 100%. I do not understand this data. Don't these people spend any money on rent or housing?
- The expenses add up to 100%.
- I do not understand this data.
- Don't these people spend any money on rent or housing?
- It is not a sensible task.
Get the Weekly English Kit 📬
New words, one handy idiom, and a 2-minute quiz — delivered to your inbox to keep your streak alive.
The expenses add up to 100%.
I do not understand this data. Don't these people spend any money on rent or housing? It is not a sensible task.
 Related Questions