
Please give me some feedback on my IELTS Writing Task 1. Thanks!
The chart below gives information about the most common sports played in New Zealand in 2002.
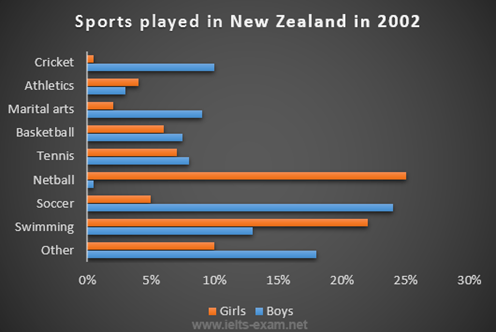
The bar chart plots the gender distribution of different sports in New Zealand in 2002. The nine categories shown are cricket, athletics, martial arts, basketball, tennis, netball, soccer, swimming, and others.
Overall, boys outnumbered girls in playing sports, with 6 out of 9 sports recording the higher percentages of male players. In addition, the gender gap can be seen evidently in netball players and soccer, but the former tended to be women’s sports and the latter was opposite.
In detail, soccer attracted the most male players (about 25%), almost five times as much as girls. Likewise, far more boys favored cricket and martial arts, around one in ten each, at least 7% higher than the data for girls. No significant gender differences can be observed in basketball and tennis while the rate in other sports was approximate 2 boys over 1 girl. By contrast, female players constituted a majority in the other three sports. A quarter of people playing netball were girls while there was a tiny proportion of merely 1% of male players. Swimming was the dominant sport of youngsters in 2002 (about 35% in total), with boys almost double the counterpart. The gender gap in athletics was marginal, whose percentages of girls and boys were 5% and 4% respectively.
Top answer
The bar chart plots the gender distribution (That is unnatural. ) of different sports in New Zealand in 2002. The nine sports categories shown are cricket, athletics, martial arts, basketball, tennis, netball, soccer, swimming, and others.
- The bar chart plots the gender distribution (That is unnatural.
- ) of different sports in New Zealand in 2002.
- The nine sports categories shown are cricket, athletics, martial arts, basketball, tennis, netball, soccer, swimming, and others.
- Overall, boys outnumbered girls in playing sports, with 6 out of 9 sports recording the higher percentages (You did not tell the reader that percentages are on the chart.
- ) of male players.
Get the Weekly English Kit 📬
New words, one handy idiom, and a 2-minute quiz — delivered to your inbox to keep your streak alive.
The bar chart plots the gender distribution (That is unnatural. It does not make sense.) of different sports in New Zealand in 2002. The nine sports categories shown are cricket, athletics, martial arts, basketball, tennis, netball, soccer, swimming, and others.
Overall, boys outnu
Sample essay for this task.
The bar chart plots the proportion of girls versus the proportion of boys who participated in popular sports in 2002 in New Zealand. Eight different sports are listed, four team sports (soccer, netball, basketball and cricket), and four individual sports (tennis, martial arts, athletics and swimming). There is also a category for other (unspecified)
 Related Questions