
Please give me some feedback on my IELTS Writing Task 1. Thanks!
The chart shows British Emigration to selected destinations between 2004 and 2007.
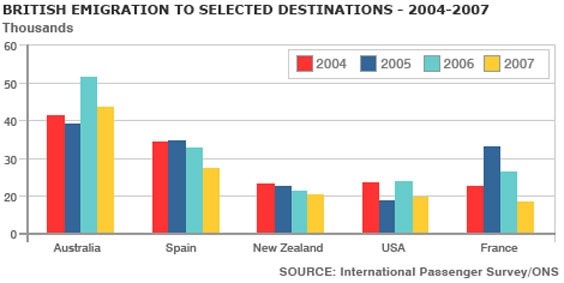
The bar chart compares the number of British emigrating to five nations, namely Australia, Spain, New Zealand, the USA, and France from 2004 to 2007.
Overall, Australia welcomed the most immigrants from British over the entire period while New Zealand and the USA were two uncommon destinations. In addition, the number of people leaving British showed a downward trend, despite the highest data were seen in 2006.
In 2004, there were nearly 42 thousand British people coming to Australia, Spain was in second place with roughly 35 thousand, followed by the USA, New Zealand, and France (about 25 thousand each). Over the next year, British emigration to Australia and USA decreased marginally by almost 3 thousand and 6 thousand respectively while that of France rose by half.
2006 recorded the largest quantity of about 160 thousand British emigrants, owing to increases of around 10 thousand and 5 thousand respectively in Australia and USA. By the final year, substantial declines occurred in British immigration of all the five countries, with the largest of roughly 9 thousand in Australia, but it still maintained the dominant position over the four years.
Top answer
The bar chart compares the number of British emigrating to five nations, namely Australia, Spain, New Zealand, the USA, and France every year from 2004 to 2007. ) over the entire period while New Zealand and the USA were the two least common uncommon destinations. In addition, the number of people leaving British showed a downward trend, except for despite the highest total data were seen in 2006.
- The bar chart compares the number of British emigrating to five nations, namely Australia, Spain, New Zealand, the USA, and France every year from 2004 to 2007.
- ) over the entire period while New Zealand and the USA were the two least common uncommon destinations.
- In addition, the number of people leaving British showed a downward trend, except for despite the highest total data were seen in 2006.
- In 2004, there were nearly 42 thousand British people coming to Austral ia, (comma splice error) Spain was in second place with roughly 35 thousand, followed by the USA, New Zealand, and France (about 25 thousand each).
- Over In the next year, British emigration to Australia and USA decreased marginally by almost 3 thousand and 6 thousand respectively while that of France rose by half.
Get the Weekly English Kit 📬
New words, one handy idiom, and a 2-minute quiz — delivered to your inbox to keep your streak alive.
The bar chart compares the number of British emigrating to five nations, namely Australia, Spain, New Zealand, the USA, and France every year from 2004 to 2007.
Overall, Australia welcomed the most immigrants from British (wrong word - British are people.) over the entire period while New Zea
The bar graph compares emigration numbers from Great Britain to Australia, Spain, New Zealand, France and the USA each year between 2004 to 2007.
Overall, Australian immigration was consistently higher than the other countries, and Spain came in second. New Zealand and the USA were the lowest and they had about the same four-year average.
In detail, there were 146 thousand emigran
 Related Questions